The
FRR
is computed according to Equation 10:
FRR = (
NRF
/
N
1
)×100%,
(10)
where
NRF
is the number of repeated features between the
features in the source image and the
FIPS
in the target image;
N
1
is the number of features in the source image. The feature
detector adopted for the source image is the
LDF
detector
without the region distinctiveness constraint. The
FIPS
is de-
tected from the target image under different
T
w
. The geomet-
ric transformation between the source image and target im-
age is computed based on manually selected control points
with a uniform distribution. Under the constraint of the
geometric transformation, if the Euclidean distance between
two features is smaller than 2 pixels, they are counted as
repeated features. In the computation, all other parameters
are set as constant:
k
= 0.06,
T
p
= 0.01×
PF
max
,
M
×
N
= 5×5,
s
% = 50%,
t
% = 5%, and
r
= 48. In the tuning, the tested
T
w
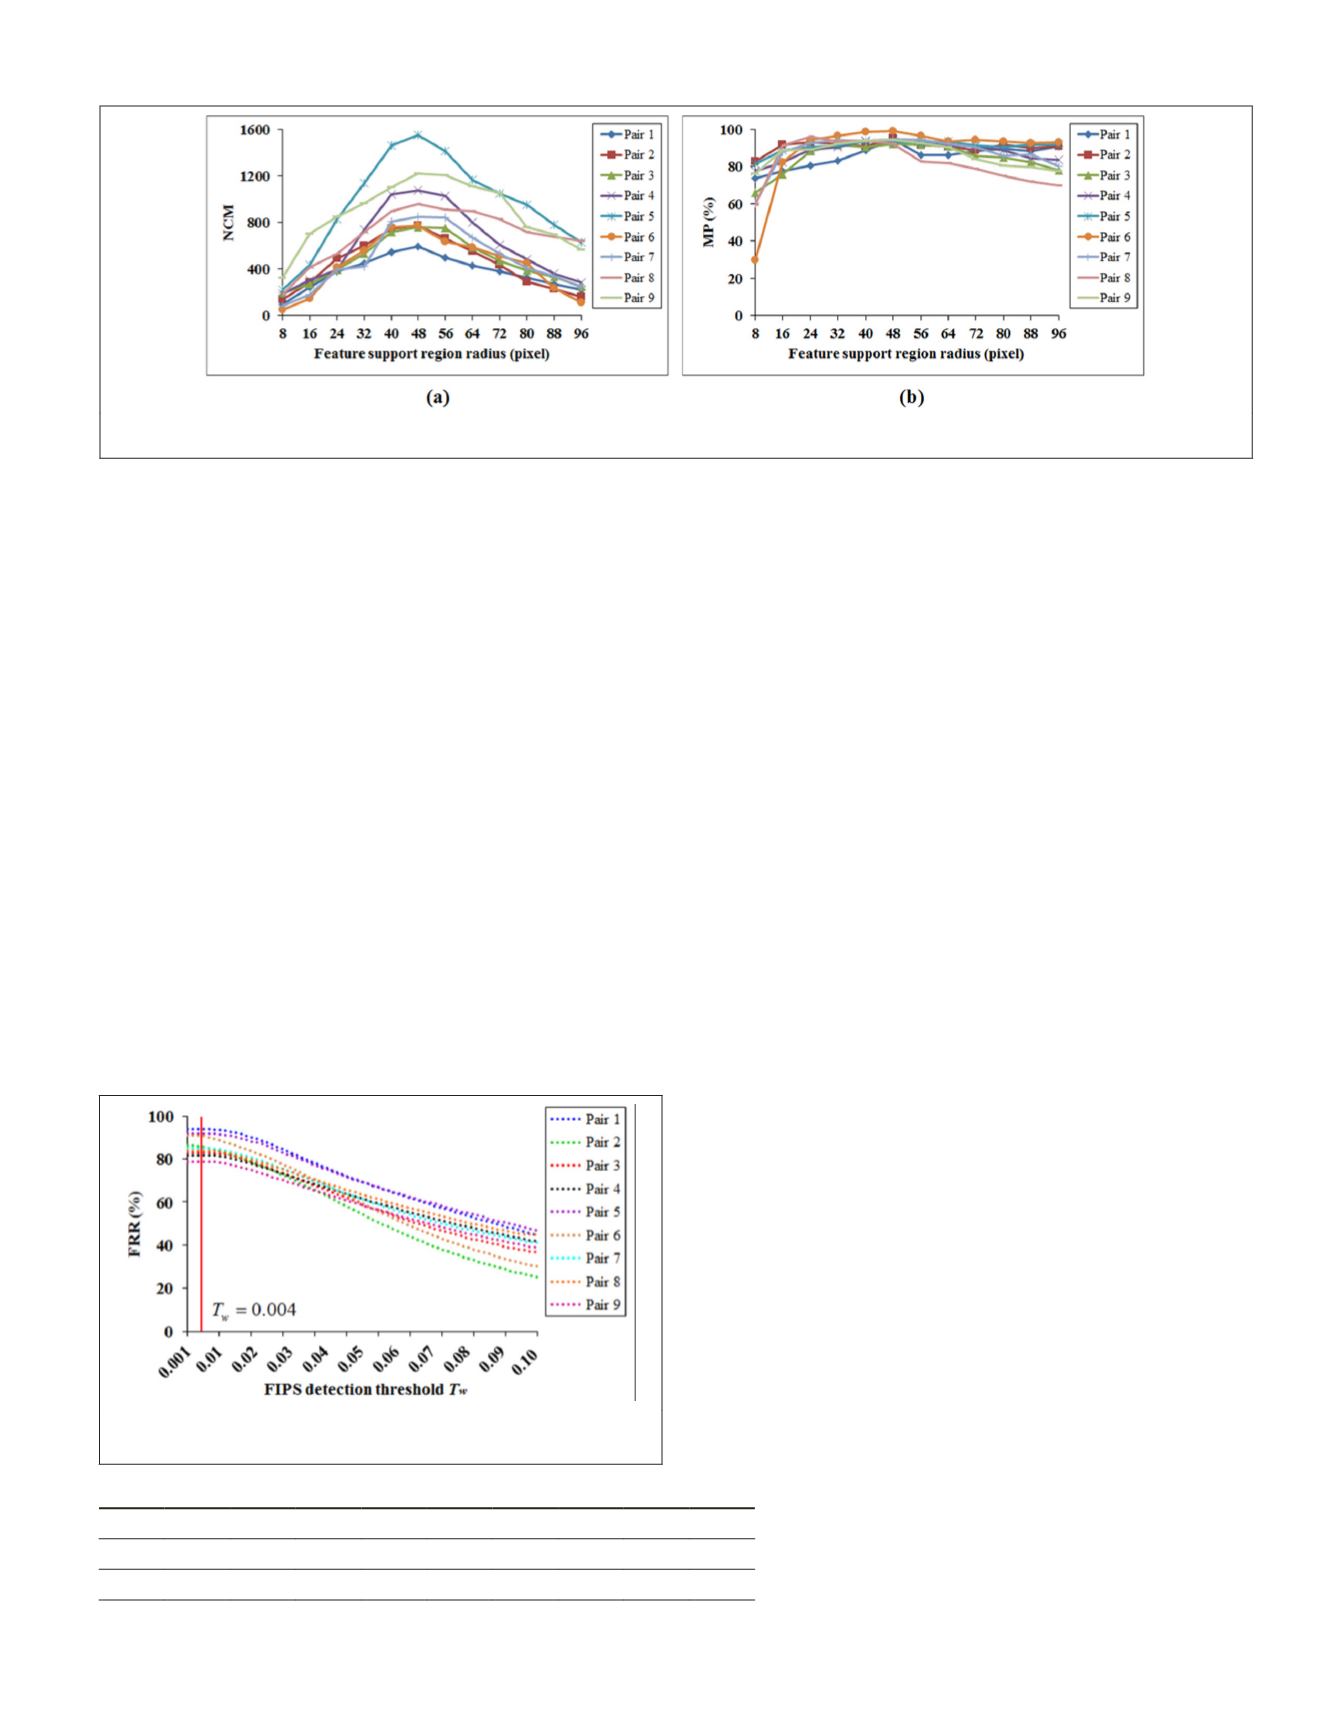
values are from 0.001 to 0.1 with a sampling interval 0.001.
The statistic
FRR
values are shown in Figure 6.
The experimental results in Figure 6 show a general trend that
smaller
FIPS
detection threshold produced higher
FRR
, since
more feeble interest points are detected under smaller thresh-
old. In this case, the corresponding points of most reference
features are contained in the
FIPS
. As the threshold increasing,
some points with smaller responses than the threshold are
eliminated. However, some of the eliminated points are the cor-
responding points of some reference features. Consequently, the
number of repeated interest points will decrease. Therefore, the
value of
FRR
decreases with the increasing threshold value
T
w
.
The results also show that the overall peak performance of
FRR
is obtained when the threshold is smaller than 0.004. There-
fore, the threshold
T
w
is set as 0.004 in the proposed method.
Matching Results and Analysis
The evaluation experiments in this subsection include four
parts: (1) the proposed
LDF
detector; (2) the proposed seed
matches selection method; (3) the proposed
FIPS
matching
strategy; and (4) the complete matching method.
Evaluation of the Proposed LDF Detector
The proposed
LDF
detector is compared with the Harris
detector based on the image pairs in Table 3. To compare
the performance of the two detectors in image matching, we
particularly enforce the number of detected points of
LDF
and
Harris to be the same. All points are described by using the
USIFT
descriptor, i.e., all features with the same support region
size (48 pixels) and orientation (0 degrees). Both methods
are implemented in the proposed matching framework. The
results of the two methods are displayed in Figure 7.
It is observed that both the
NCM
and
MP
values of the
LDF
-
based method are higher than those of the Harris method. The
region distinctiveness factor in the
LDF
detector is defined
based on descriptor similarity. Features with high region dis-
tinctiveness values (Equation 5) detected by the
LDF
detector
have low similarities with other points in its local regions, thus
to make them very distinctive. Compared with that, the Harris
detector finds corners according to corner response which only
reflects the geometric distinctiveness of isolated point, and
also the relationship between different points is not considered
in the detection. Many points with repetitive local patterns are
detected as features, which leads to potentially false matches
due to highly similar points detected in the image.
Evaluation of the Proposed Seed Matches Selection Method
In our experiments, each image described in Table 3 is divid-
ed into 5×5 sub-regions. Therefore, the ideal result is to obtain
25 pairs of seed matches for each pair of images. The seed
matches of the nine pairs of images are manually checked and
the checking results are listed in Table 4.
It is observed that the obtained seed matches are very
reliable. In some cases, less than 25 pairs of seed
matches have been obtained because local image
distortion resulted in some correct seed matches
not satisfying the global geometric constraint in
the
RANSAC
framework and being eliminated. The
matching results with and without the seed match
Figure 5. Experimental results of feature support region radius tuning based on the images described in Table 3: (a)
NCM
values, and (b)
MP
values.
Table 4. Seed matches checking results.
Pair 1 Pair 2 Pair 3 Pair 4 Pair 5 Pair 6 Pair 7 Pair 8 Pair 9
NCM 25 25 24 25 24 25 25 23 25
MP 100% 100% 100% 100% 100% 100% 100% 100% 100%
Figure 6. Experimental results of
FIPS
detection threshold
tuning based on the image pairs described in Table 3.
PHOTOGRAMMETRIC ENGINEERING & REMOTE SENSING
August 2018
519


