However, this procedure is very
time consuming since it needs to
do similarity computation for every
pixel in the search area. To solve
this problem, we define a small
set of interest points in each of the
search area (termed feeble inter-
est points set (
FIPS
)) in the target
image by thresholding the pixel
distinctiveness. The threshold
value defined as
T
w
·
PF
max
is very
small (much smaller than the pixel
distinctiveness factor threshold
T
P
in
LDF
s detection), where
PF
max
is
the maximum pixel distinctiveness
factor value in the search area. In
the proposed method, the matching
process is only performed in
FIPS
using
NNDR
method.
It is reasonable to use a small
set of points in the search area to
perform the matching, since the
corresponding point of each highly
distinctive point in the source im-
age has much higher chance to lo-
cate at distinctive pixels, and scan-
ning over all the pixels may not
necessarily bring higher success
rate rather than ambiguities. On
the other hand, the
FIPS
contains
sufficient low feature-response in
comparison to traditional method,
thus to avoid missing matches. In
addition, since the feature descrip-
tors of most
FIPS
points are com-
puted in the
LDF
s detection step,
the matching (through descriptor
distance computation) can be per-
formed very efficiently.
Experimental Results and Analysis
Experimental Datasets
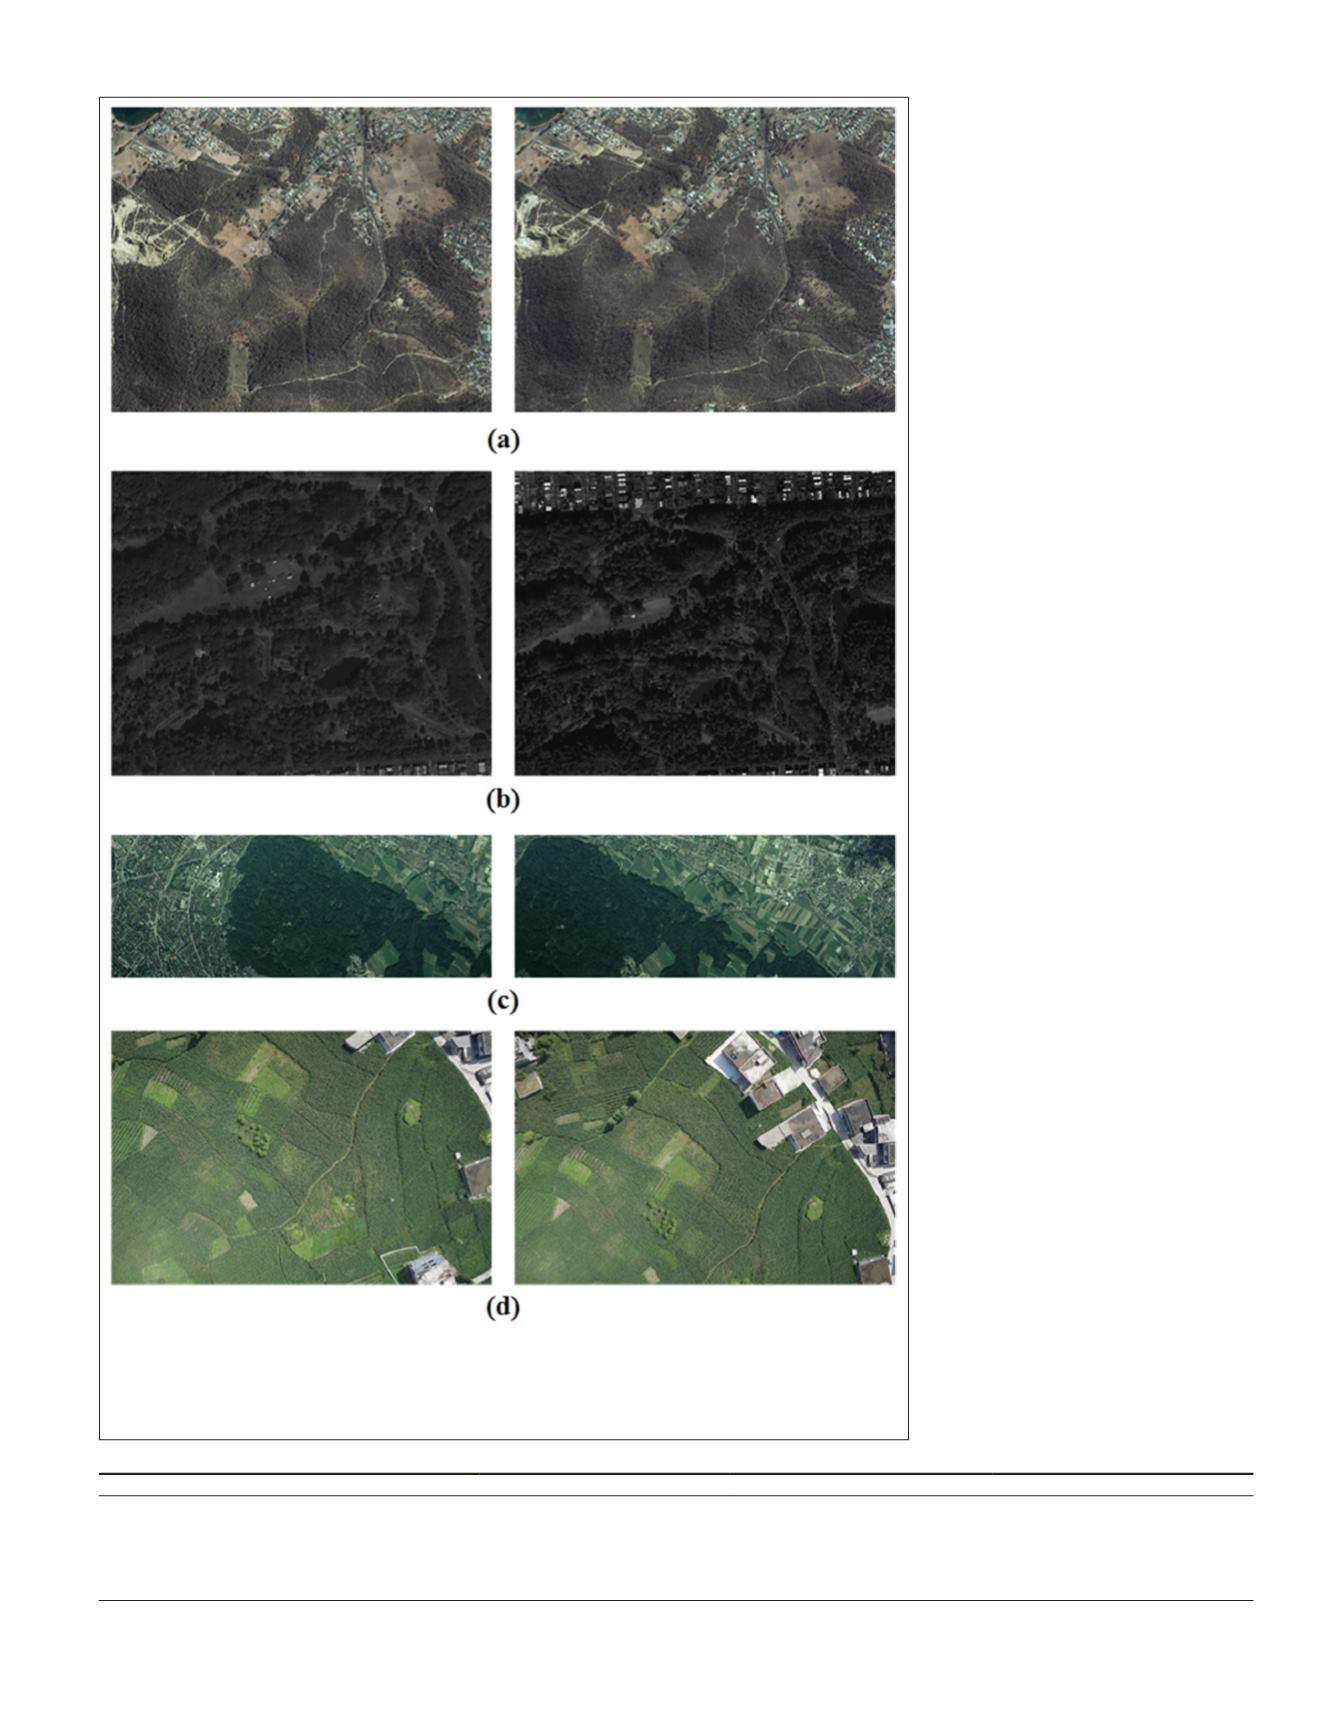
Our experimental datasets are
shown in Figure 3, including
satellite, aerial, and
UAV
images.
We particularly choose our data
containing highly repetitive pat-
terns such as trees and crops. The
information of the experimental
datasets are provided in Table 1.
Evaluation Criteria and Thresholds Setting
Evaluation Criteria
Two widely used indicators,
number of correct matches (
NCM
)
and matching precision (
MP
) are ad-
opted to evaluate the performance
of the proposed method.
MP
is cal-
culated according to Equation 8:
Table 1. Experimental datasets.
No.
Image source
Test site
Ground sample distance (GSD)
Image size (unit: pixel)
Dataset 1
IKONOS
Hobart Tasmania, Australia
1.0 meter
2000×1600
Dataset 2 WorldView-2 & QuickBird
San Francisco, USA
0.5 meter & 0.61 meter
2000×1600
Dataset 3
Aerial
Zurich, Switzerland
0.38 meter
13000×4896
Dataset 4
UAV
Guizhou, China
0.01 meter
5456×3632
Figure 3. Experimental datasets. (a) Dataset 1: a pair of
IKONOS
pan-sharpened natural color
images (DigitalGlobe
®
), (b) Dataset 2: a pair of WorldView-2 image and QuickBird image.
The left image is the WorldView-2 image and the right image is the QuickBird image, (c)
Dataset 3: a pair of aerial images, and (d) Dataset 4: a pair of
UAV
-based agricultural images.
In each pair, the left image is the source image and the right image is the target image.
PHOTOGRAMMETRIC ENGINEERING & REMOTE SENSING
August 2018
517


