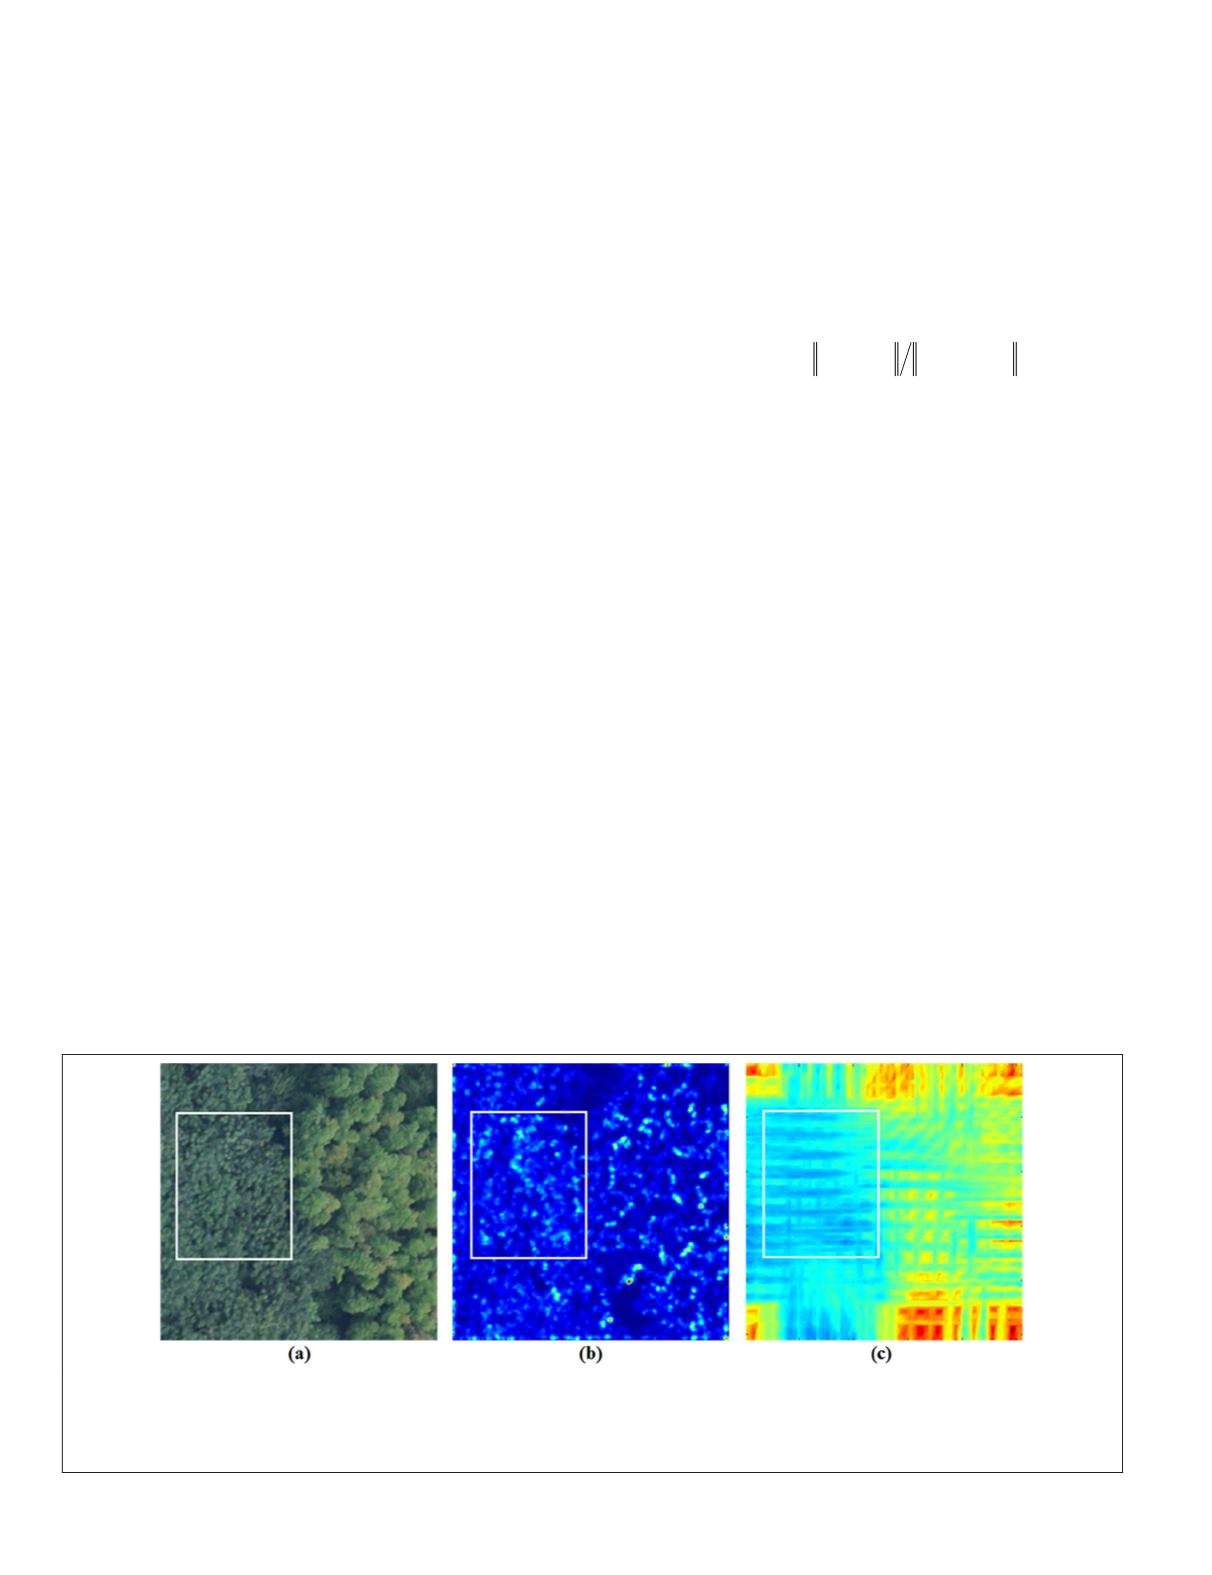
many repetitive patterns of leaves exist in this sub-region,
which are normally difficult to match correctly. As compared
with the pixel distinctiveness factor, we can see from Figure
2c that those pixels with strong pixel distinctiveness in this
sub-region have relatively low region distinctiveness values
and finally they will not be detected as
LDF
s.
The complete workflow of the proposed
LDF
detector is as
follows:
Step 1: the first partial derivatives are computed and the
covariance matrix is constructed for each pixel;
Step 2: the value of the pixel distinctiveness factor in
Equation 5 is computed for each pixel. Pixels with pixel
distinctiveness factor values smaller than a threshold
T
p
are
eliminated. The following feature detection is only performed
in the remaining pixels;
Step 3: the input image is divided into
M
×
N
sub-regions
(5×5 in our method). In each sub-region, the feature response
is computed for each remaining pixel according to Equation
5. The descriptor comparison in the region distinctiveness
factor computation is only performed between the remaining
pixels in the sub-region.
Step 4: non-maximum suppression using a 3×3 mask is ap-
plied to the feature response. In each sub-region, the first
s
%
pixels with greatest feature response are detected as
LDF
s.
s
%
is a user-defined threshold.
In practical application, the approximate overlap region
between images can be estimated using the geo-referencing
information of the images. Therefore, the feature detection
and matching are only performed in the overlap region of im-
ages in the proposed matching framework.
Reliability Guided Seed Point Selection and Matching
In each sub-region, the first
t
% of the most distinctive
LDF
s
are selected as seed points. Because the overlap region is
divided into
M
×
N
sub-regions in the detection of
LDF
s, the
seed points matching can only be performed in corresponding
sub-regions. To increase the reliability of seed points match-
ing, a bidirectional matching strategy is adopted. For a seed
point
p
i
in sub-region
Q
of the source image, its correspond-
ing candidate
q
j
is found from the seed points set in sub-re-
gion
Q
' of the target image by using the
NNDR
method (forward
matching), where
Q
and
Q
' are a pair of coarse corresponding
sub-regions. The corresponding candidate for
q
j
from the seed
points set in source image is also computed using this method
(backward matching). The two seed points
p
i
and
q
j
are con-
sidered as a pair of seed match only when the forward and
backward matching results are consistent.
A few seed matches are needed to compute a coarse geo-
metrical transformation between images. For this purpose, the
reliability of seed matches is more important than the number
of seed matches. Therefore, only highly reliable seed matches
are selected from the seed point matching result. Generally,
if two feature descriptors are very similar and they are both
distinctive, these two features are more likely to be a pair of
match. Therefore, a matching reliability indicator is pro-
posed to evaluate the reliability of seed match on the basis of
descriptor distance (similarity) and feature response (distinc-
tiveness) as shown in Equation 6:
MC
D D FR FR
ij
p q
p
q
i
j
i
j
= − −
+
(
)
exp
,
(6)
where (
p
i
,
q
j
) is a pair of seed match,
MC
ij
is the defined
matching reliability indicator,
D
p
i
and
FR
p
i
are the feature de-
scriptor and feature response of
p
i
in the source image.
D
q
i
and
FR
q
i
are the feature descriptor and feature response of
q
i
in
the target image. exp( ) is used to scale the value to the range
of (0, 1]. If a pair of match shows a small descriptor distance
and large feature response, it has high matching reliability
value according to Equation 6. In the proposed method, only
the pair of seed matches with the highest matching reliability
value in each sub-region is kept. All the kept seed matches
are further filtered by using
RANSAC
method. The bidirectional
matching, matching reliability measure and
RANSAC
filter
ensure the final seed matches being very reliable.
FIPS Search Strategy Based Feature Matching
We use a second order polynomial functions (Equation 7) to
describe the coarse geometric transformation between the im-
ages based on seed matches using the least squares method.
x a a x a y a x a x y a y
y b b x b y b x b
2 0 1 1 2 1 3 1
2
4 1 1 5 1
2
2 0 1 1 2 1 3 1
2
4
= + + + +
+
= + + + +
x y b y
1 1 5 1
2
+
,
(7)
where (
x
1
,
y
1
) and (
x
2
,
y
2
) are the coordinates of seed matches
in the source image and target image, respectively.
a
0
, … ,
a
5
and
b
0
, … ,
b
5
are the polynomial coefficients.
A coarse position of the correspondence for each
LDF
in
the source image can be computed according to the transfor-
mation (Equation 7), thus the search area is only limited to
this region to reduce the computational time. Generally, the
search area is set relatively large to avoid missing detections.
Figure 2. Pixel distinctiveness factor and region distinctiveness factor comparison. The white-box region shows the
distinctiveness of a sub-region: (a) Original test image, (b) Pixel distinctiveness map, and (c) Region distinctiveness map.
The pixel distinctiveness factor and region distinctiveness factor values shown in the figures are colored with a standard jet
colormap where blue color and deep red color denote minimum and maximum values, respectively. Those values in between
are shades of blue, green, yellow, and red.
516
August 2018
PHOTOGRAMMETRIC ENGINEERING & REMOTE SENSING


