As a result, rulesets specific to each group of locations needed
to be created to achieve high accuracy. The development and
maintenance of robust rule sets applicable for multiple scenes
would likely be time and cost prohibitive.
Accuracy of Bi-temporal Products
Evaluating the effectiveness of bi-temporal, change detec-
tion approaches to delineating new crack damage involved
the creation of image processing models, post-classification
comparison of
GEOBIA
classifications in eCognition, and both
supervised and unsupervised classifications of bi-temporal
layer stack images. Multiple outputs were generated using
each method to test the effective-
ness of various combinations of
techniques and thresholds.
The raster modeling approach
using
ERDAS
Imagine software for
the detection of fine-scale crack
damage is based on the spatial
filtering of a blue band difference
image. Table 2 summarizes the
accuracy results of the final set of
parameters that were used for test-
ing the fully tuned model. A 5 × 5
pixel Sobel filter was used for the
generation of a texture image. Edge
pixels in the texture image with a
value of more than 0.15 standard
deviations away from the global
mean were masked to eliminate
preexisting cracks and lane divid-
ers from being falsely detected as
new cracks. Focal minimum filters
used to compensate for residual
misregistration effects were tested
at odd numbered kernel sizes from
3 × 3 to 11 × 11, with the ideal size
being 7 × 7. The use of a 7 × 7 focal
minimum filter greatly improved
the overall user’s accuracy from
17.3 percent to 69.1 percent while
also having a small positive effect
on the producer’s accuracy, rais-
ing it from 76.6 percent to 77.9
percent. Another key tool used in
the
ERDAS
model is the set of focal
majority filters for large object
elimination. These filters gradually
dissolve objects and eliminate the
movement of cars from being de-
tected as new changes of interest.
This is particularly useful when
primary imagery depicts busy
roads or bridges, as any light-col-
ored cars in time 1 will be detected
as negative changes in brightness
as compared to the dark road sur-
face in the time 2 image.
A key variable in many change
detection routines that rely on im-
age differencing is the threshold
at which change is determined to
have occurred. Through iterative
testing of varying threshold levels
from −0.25 to –0.075, the ideal
value that retained the most actual features while minimizing
the frequency of false detections was determined to be −0.15.
Overall, the fully tuned model performs well and yields
the highest composite producer’s and user’s accuracies of all
methods tested. The computational simplicity of this model
is also a strength, as it does not rely on complex segmenta-
tion routines to be successful. Instead, simple kernel filter
based operations are performed in sequence to systematically
eliminate detected changes that do not fit the spectral and
Table 1. Accuracy report for single-date
GEOBIA
crack classification.
Image Scene
# of
Cracks
Correct
Detections
False
Detections
Producer’s
Accuracy
User’s
Accuracy
Lake Murray 1 291
275
177
94.5% 60.8%
Lake Murray 2 164
128
159
78.0% 44.6%
Albuquerque 36
26
143
72.2% 15.4%
Camp Roberts 32
22
17
68.8% 56.4%
Total
523
451
505
86.2% 47.6%
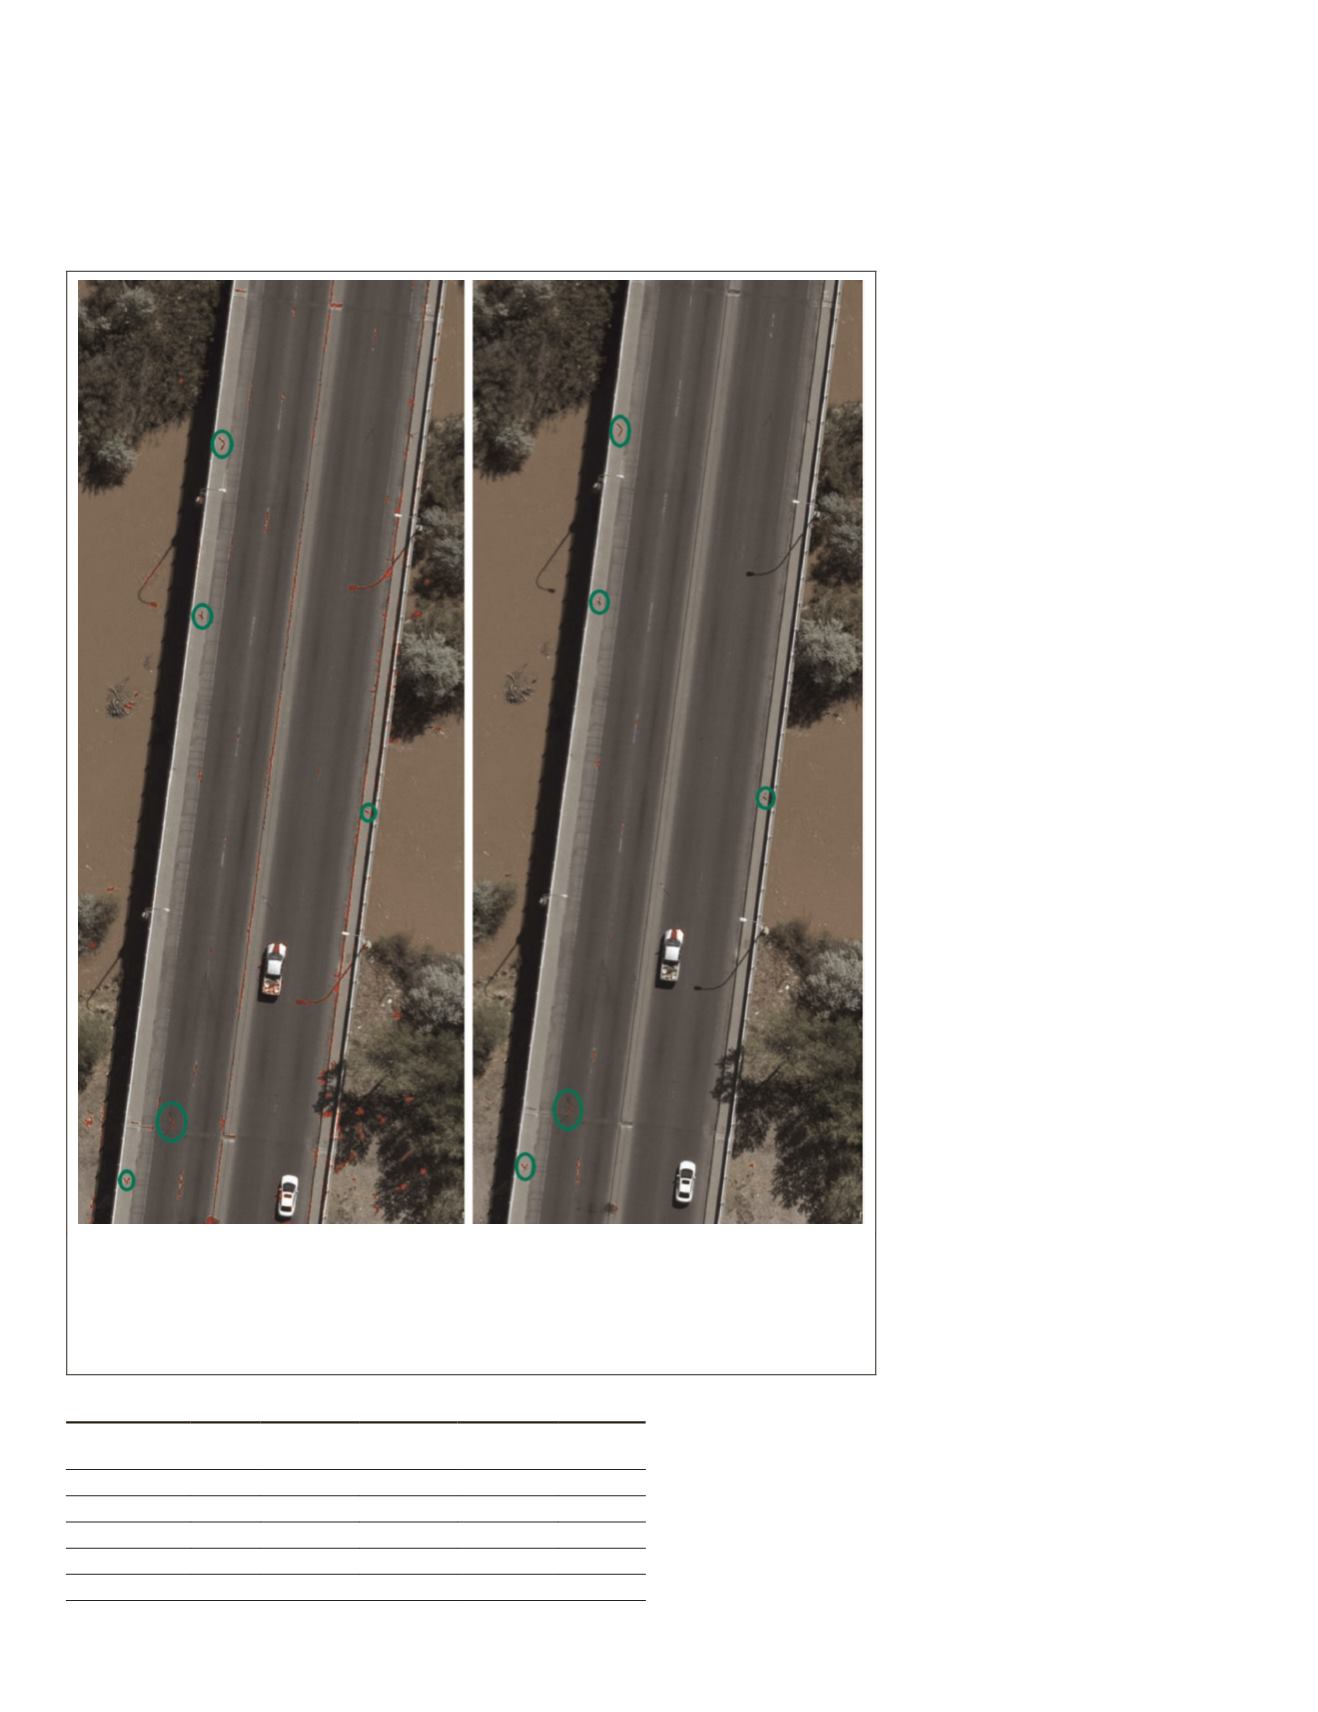
Figure 5. Comparison of single-date
GEOBIA
classification results without directional
filtering (left) and results with directional filtering based on angular orientation (right).
Detected features were excluded from classification as a crack if their main direction
was within ±6 degrees of the angular direction of the main road surface. This limited
the number false detections created by road markings and lane dividers. All objects
detected cracks are shown in red. Actual cracks detected are circled in green.
82
February 2018
PHOTOGRAMMETRIC ENGINEERING & REMOTE SENSING


