detections, the raster processing change detection model
yielded the highest composite accuracy at 53.8 percent.
In addition to being the most successful method of detect-
ing and delineating fine-scale crack damage based on com-
posite accuracy that incorporates both producer’s and user’s
accuracy, the raster processing model also provides additional
information by revealing when damage appears. It is only
possible to make this important distinction when before and
after imagery are available for analysis. The change detection
approach allows the image analyst to understand the cause of
observed damage by knowing if it occurred before or after a
hazard event. This method of bi-temporal change detection le-
verages the
RSI
image capture method to minimize registration
error, allowing this process to be conducted in near real-time
using computationally simple second-order polynomial warp-
ing. The production and archiving of an organized catalog of
baseline imagery and camera station coordinates allows com-
parison of before and after damage states, facilitating the rapid
creation of actionable change detection information. The
products generated using the semi-automated methods tested
in this study could be implemented in near real-time to assist
emergency first responders, increasing public safety and help-
ing to minimize the loss life after a hazard event. Based on
the results of this study, the cost associated with the capture
and management of an up-to-date catalog of baseline imagery
depicting critical infrastructure sites seems to be valid.
The most significant limitation of this research was the
inability to obtain imagery of actual damage features in a
bi-temporal context. As real roads and bridges could not be
subject to damage needed to employ the
RSI
image capture
technique used in this research, proxy damage features
were the only option. The use of black tape to mimic cracks
gave the best approximation of actual damage features, as
they very closely resemble actual cracks in both shape and
spectral characteristics at the resolutions used in this study.
Additionally, sun glint created by the tape in some scenes
made detection more challenging for some images.
Even though similar, these proxy damage features will
not
exactly
replicate the shape or spectral characteristics of
actual cracks, and further re-
search utilizing scenes containing
actual damage would be useful.
To accomplish this, a catalog of
baseline data should be collected
for critical infrastructure features
within hazard prone areas, and in
the unfortunate event of a natural
disaster or other event that causes
road damage to occur, these images
could be used as testing data to
validate and improve the effective-
ness of these techniques. Another
option is “reverse engineering,” by
capturing images of damaged roads
or bridges that are scheduled to be
repaired or resurfaced. If the new
surface has similar composition
and spectral characteristics of the
damaged surface, the before and
after images could be reversed.
The ability to rapidly and
accurately distinguish damage
features from noise in a complex
scene is of great importance for the
advancement of a time sensitive
remote sensing system for disaster
response. Manual interpretation
of imagery alone can be time and
labor intensive, making it question-
ably appropriate in time sensitive
applications (Lippitt
et al.
, 2014).
This emphasis on timeliness dic-
tates the need for a near real-time
method of automatically identify-
ing damage features manifested
after a disaster event. The semi-
automatic feature identification
methods tested in this study utilize
radiometric, spectral, temporal,
and contextual information to
distinguish features of interest from
similar features not representing
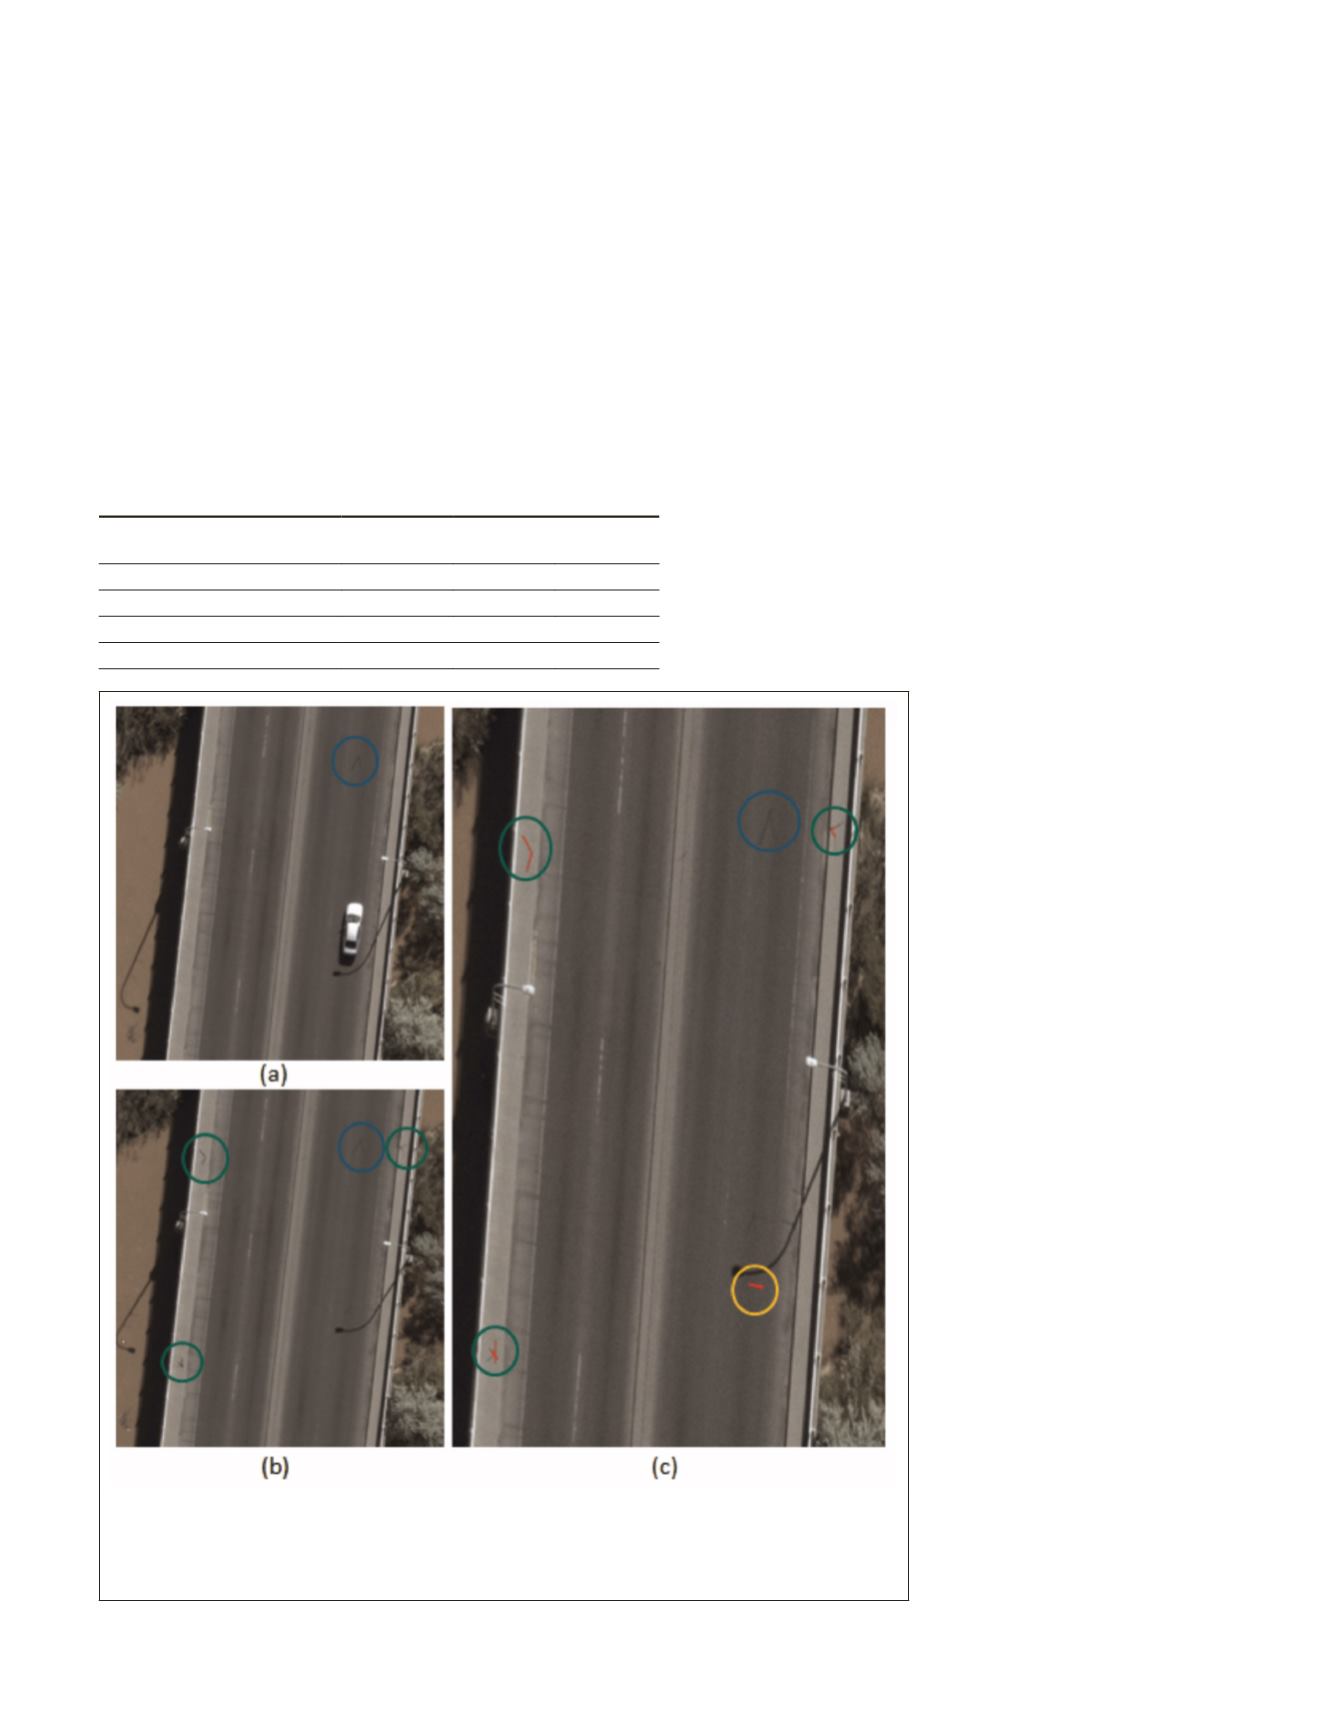
Figure 8. Enlarged section of an
ABQ
scene classification generated with the raster
processing model: Time 1 (a), time 2 (b), and the final change product (c). Newly
detected cracks are displayed in red. Blue = Preexisting crack, Green = New /
Successfully detected crack, Orange = False detection. In this section, three out of three
actual cracks are detected with one false detection.
Table 4. Accuracy summary of all methods. Composite accuracy
was calculated as the product of the producer’s accuracy and
user’s accuracy. As a result of its high user’s accuracy, the
raster processing model was the most effective at detecting and
delineating cracks while minimizing false detections
Method
Producer’s
Accuracy
User’s
Accuracy
Composite
Accuracy
GEOBIA
86.2% 47.6% 41.0%
GEOBICA
85.8% 41.1% 35.3%
Unsupervised Layer Stack
65.7% 19.4% 12.8%
Raster Processing Model
77.9% 69.1% 53.8%
PHOTOGRAMMETRIC ENGINEERING & REMOTE SENSING
February 2018
85


