spatial characteristics of new crack damage. Unlike the
GEOBIA
and
GEOBICA
approaches, the raster processing model is almost
fully automated, requiring no user modification as the same
parameters and thresholds are applied to all the images tested.
The bi-temporal layer stack method utilized the same
supervised and unsupervised routines used in the single-date
classification. Instead of using a three band post-event image
as input, a six band bi-temporal composite image was clas-
sified. With both spectral and temporal information content
to exploit, the classifier is more successful in limiting false
detections than those products using only post-event imagery
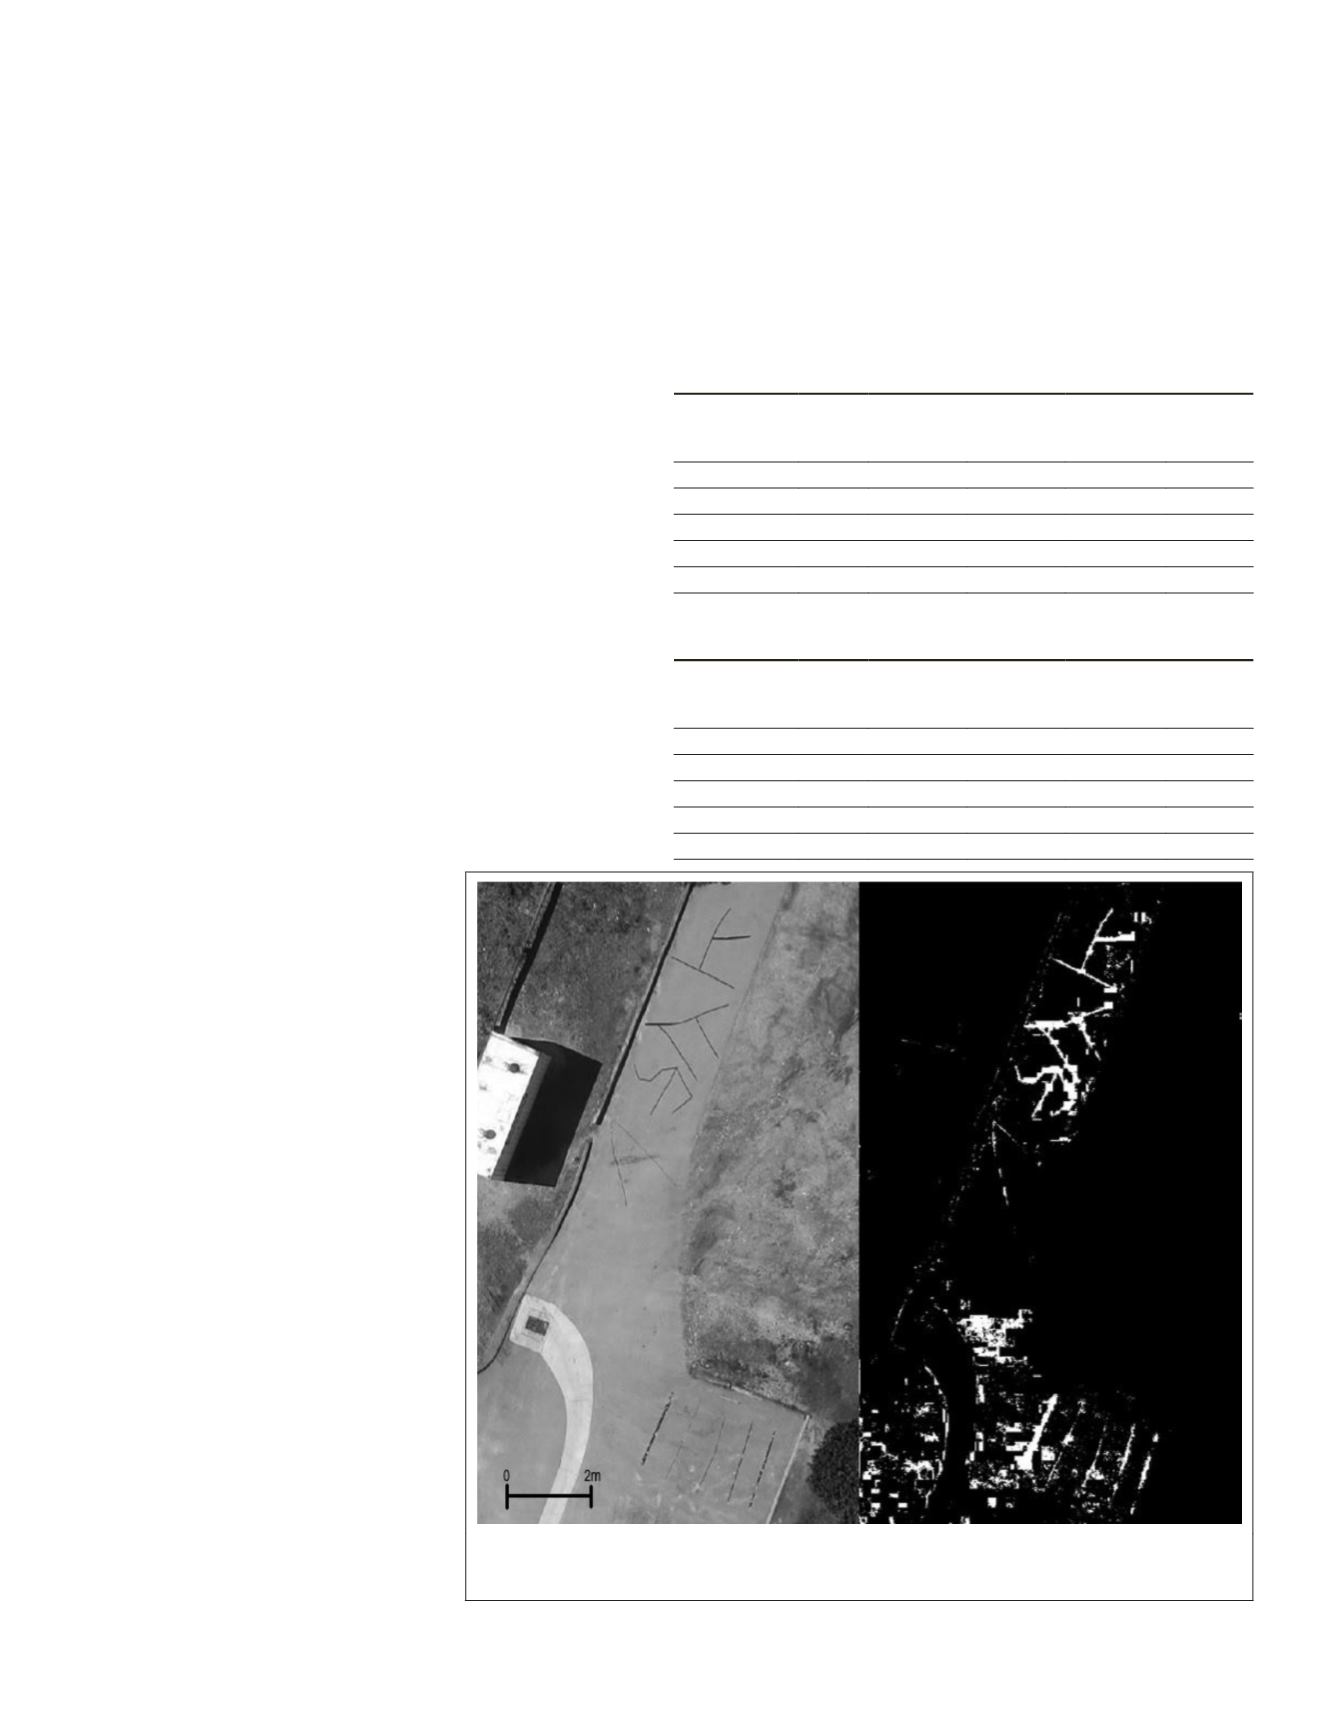
as input. However, as shown in Figure 6, the supervised clas-
sification using the layer stack image as input yields numer-
ous false detections, similar to the single-date classification.
This made accuracy assessment based on the number of false
detections infeasible. The unsupervised classification is mod-
erately successful in detecting and delineating new cracks,
achieving a 65.7 percent producer’s accuracy. The unsuper-
vised classification is more successful in limiting the number
of false detections than the supervised method, but with a
user’s accuracy of just 19.4 percent, produces more measur-
able false detections than any other bi-temporal method.
The (
GEOBICA
) method is based on post-classification
comparison of the original
GEOBIA
classification products to
detect and delineate new cracks. As suggested by Stow
et al.
(1980), the 78.4 percent overall producer’s accuracy of the
post-classification comparison is similar to the product of the
86.2 percent accuracy of the original classifications. As with
the single-date
GEOBIA
classification, the producer’s accuracy
is high (78.4 percent), but there are many false detections, re-
sulting in a 38.9 percent user’s accuracy as shown in Table 3.
Discussion and Conclusions
The effectiveness of the single-date
methods tested for the detection and
delineation of cracks was sharply
different for the pixel-based and
object-based methods, with the
GEOBIA
methods being superior. The
pixel-based, single-date products are
unusable due to extremely high levels
of false detection. The
GEOBIA
method
was more successful in detecting and
delineating cracks than the pixel-
based methods, but still returned a
significant number of false detections.
Even though more false detections
than accurate detections were made,
the
GEOBIA
product generated could
still be useful to an image analyst
for the detection of fine-scale crack
damage.
Even with extremely high accuracy
classification, any single-date method
lacks the ability to distinguish be-
tween new and pre-existing damage
features. The ability to determine if a
detected damage feature is the result
of a recent event such as an earth-
quake or preexisting is an extremely
important distinction to be able to
make after a hazard event. Using
single-date methods, an image analyst
would be unable to distinguish be-
tween a bridge displaying preexisting
crack damage that has no apparent
effect on its ability to function safely,
and a bridge that displays new cracks appearing as the result
of an earthquake. A bridge exhibiting new damage caused by
a hazard event should be prioritized for immediate inspection
to ensure its safety, while a bridge whose condition had not
changed would not need immediate attention.
Without the knowledge of when the detected cracks ap-
peared, no distinction between the conditions of the two
bridges can be made. Knowing the cause of the observed
damage features could prevent critical resources being misal-
located in the inspection of the unchanged, safely functioning
bridge that displays preexisting damage. This could put lives
Figure 6. Example source image (left) and supervised layer stack classification
product (right). Pixel groups detected as cracks are shown in white, while pixels
associated with all other classes
Table 2. Accuracy report for
ERDAS
imagine raster processing model.
Image Scene
# of
New
Cracks
Correct
Detections
False
Detections
Producer’s
Accuracy
User’s
Accuracy
Lake Murray 1 99
90
12
90.9% 88.2%
Lake Murray 2 83
53
33
63.9% 61.6%
Albuquerque 8
7
20
87.5% 25.9%
Camp Roberts 14
9
6
64.3% 60.0%
Total
204
159
71
77.9% 69.1%
Table 3. Accuracy report for the bi-temporal
GEOBICA
crack
classification.
Image Scene
# of
New
Cracks
Correct
Detections
False
Detections
Producer’s
Accuracy
User’s
Accuracy
Lake Murray 1 99
93
73
93.9% 56.7%
Lake Murray 2 83
51
70
61.4% 42.1%
Albuquerque 8
7
77
87.5% 8.3%
Camp Roberts 14
9
31
64.3% 22.5%
Total
204
160
251
78.4% 38.9%
PHOTOGRAMMETRIC ENGINEERING & REMOTE SENSING
February 2018
83


