the effect of the exponent values as an important factor for
FMC
needs to be explored. The following discussion will fur-
ther illuminate these issues.
Comparison of FMC and MRB
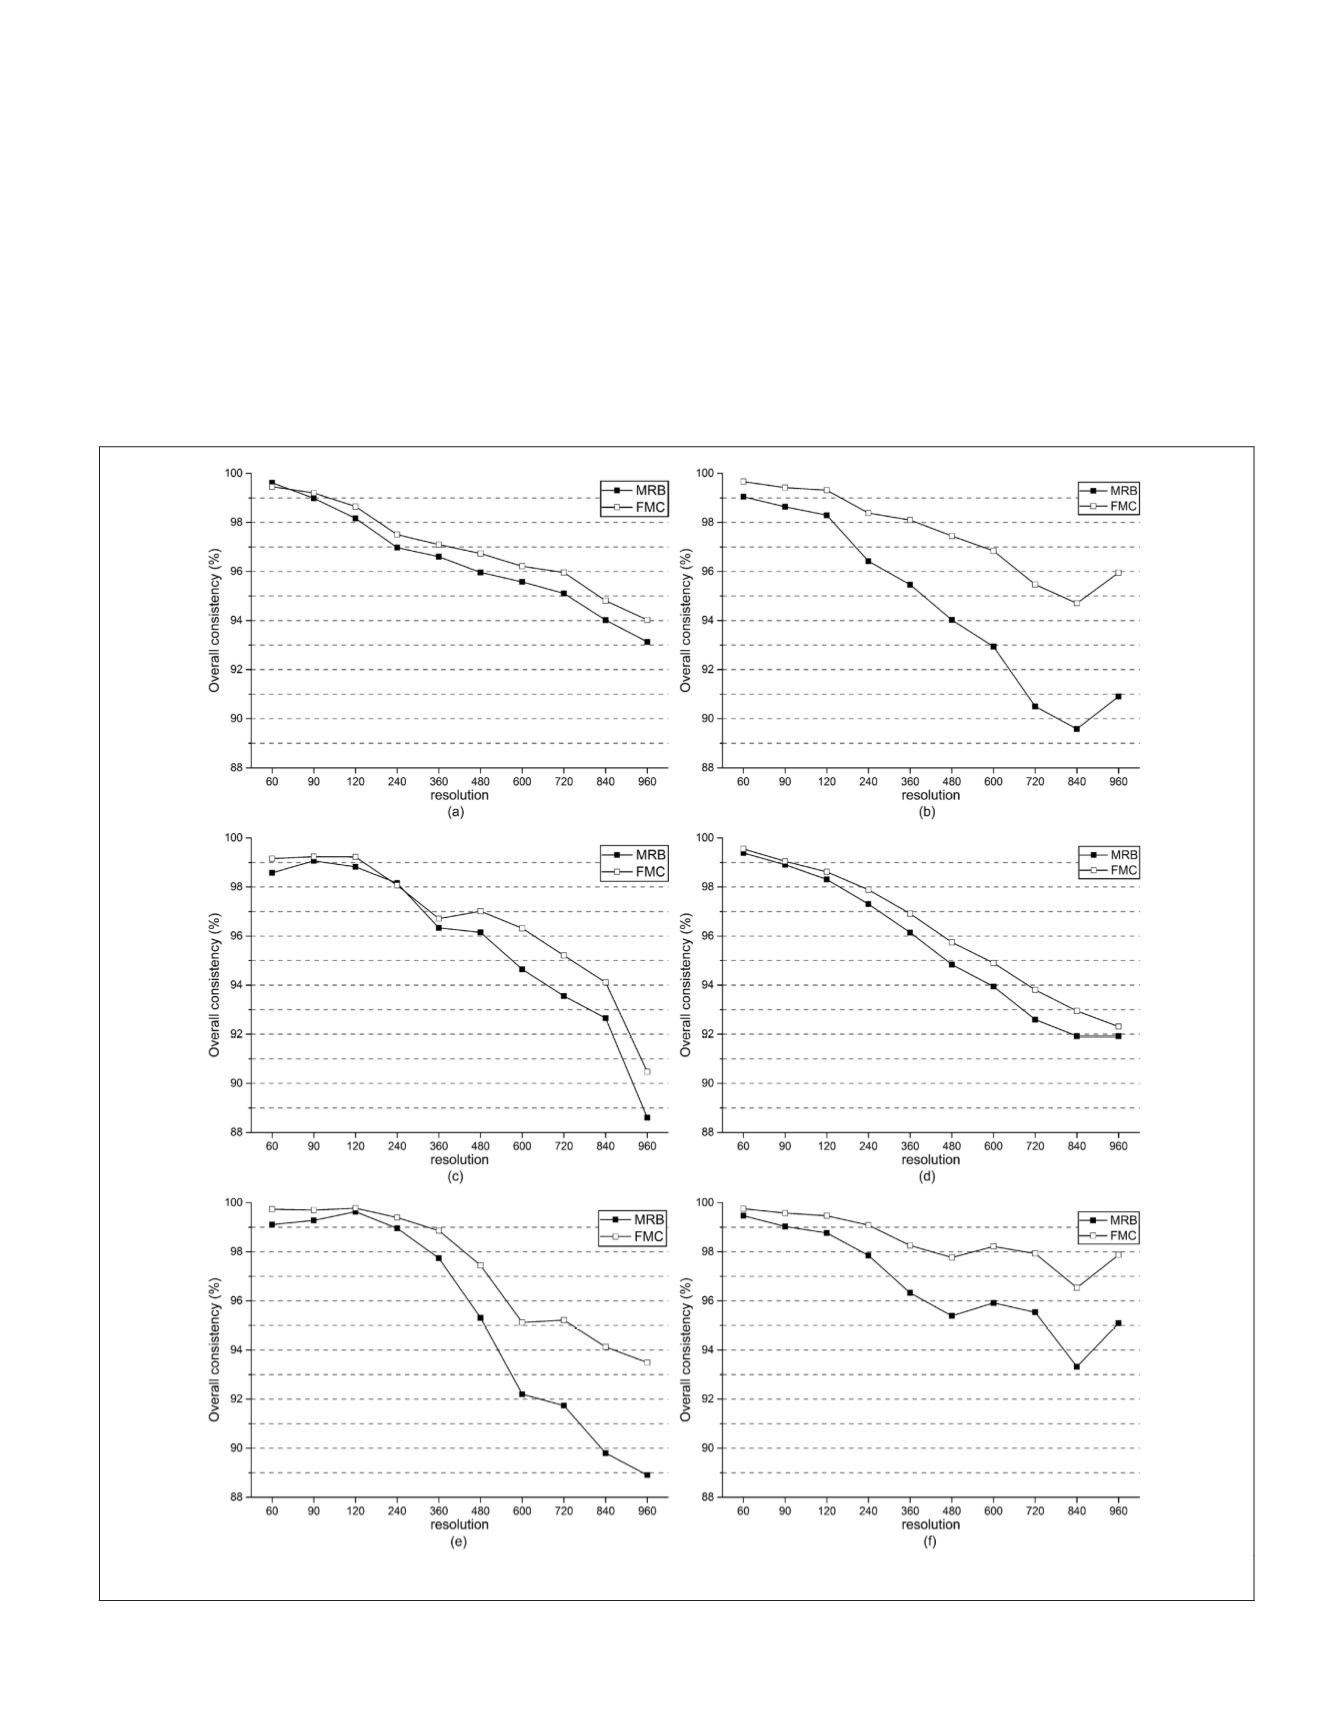
FMC
obtained higher
OC
because it integrated uncertainty and
spatial structure information (i.e.,
CMP
and
CLP
) to deter-
mine the map class type in the upscaled, coarse-resolution
map. For example, in ASD1870, the
OC
obtained using
FMC
was reduced from 99.73 percent to 93.50 percent, while
OC
obtained using
MRB
was reduced from 99.10 percent to 88.90
percent (Figure 3e). Figure 3 clearly shows higher values of
OC
derived from
FMC
than
MRB
in each study area for all cat-
egories of the upscaled, coarse-resolution maps. These results
demonstrate that fusing uncertainty information from land
cover maps (i.e.,
CLP
) and land cover distribution (i.e.,
CMP
derived from
MRB
maps) can produce coarse-resolution maps
with higher
OC
compared to
MRB
alone.
In addition,
PE
of
FMC
for each class was lower than
PE
of
MRB
, in most cases. For example, in
ASD
4530, the PEs of corn
produced by
FMC
were lower by 1.85 percent, 1.09 percent, 2.12
percent, 3.88 percent, 4.00 percent, 3.87 percent, 4.15 percent,
3.56 percent, 3.27 percent, and 3.10 percent, respectively, for
the upscaled, coarse maps at 60 m, 120 m, 240 m, 360 m, 480
m, 600 m, 720 m, 840 m, 960 m resolutions (Figure 5). These
results further strengthen our confidence that
FMC
should be
applied to upscale maps. Moreover, fusing uncertainty infor-
mation (i.e., land cover distribution, and the confidence level
of land cover maps) is a potential way to further improve the
Figure 3.
OC
of
FMC
and
MRB
for each study areas: (a), (c), and (e) are heterogeneous areas:
ASD
1810,
ASD
1830, and
ASD
1870,
respectively; (b), (d), and (f) are homogeneous areas:
ASD
4530,
ASD
4550, and
ASD
4580, respectively.
PHOTOGRAMMETRIC ENGINEERING & REMOTE SENSING
February 2018
93


