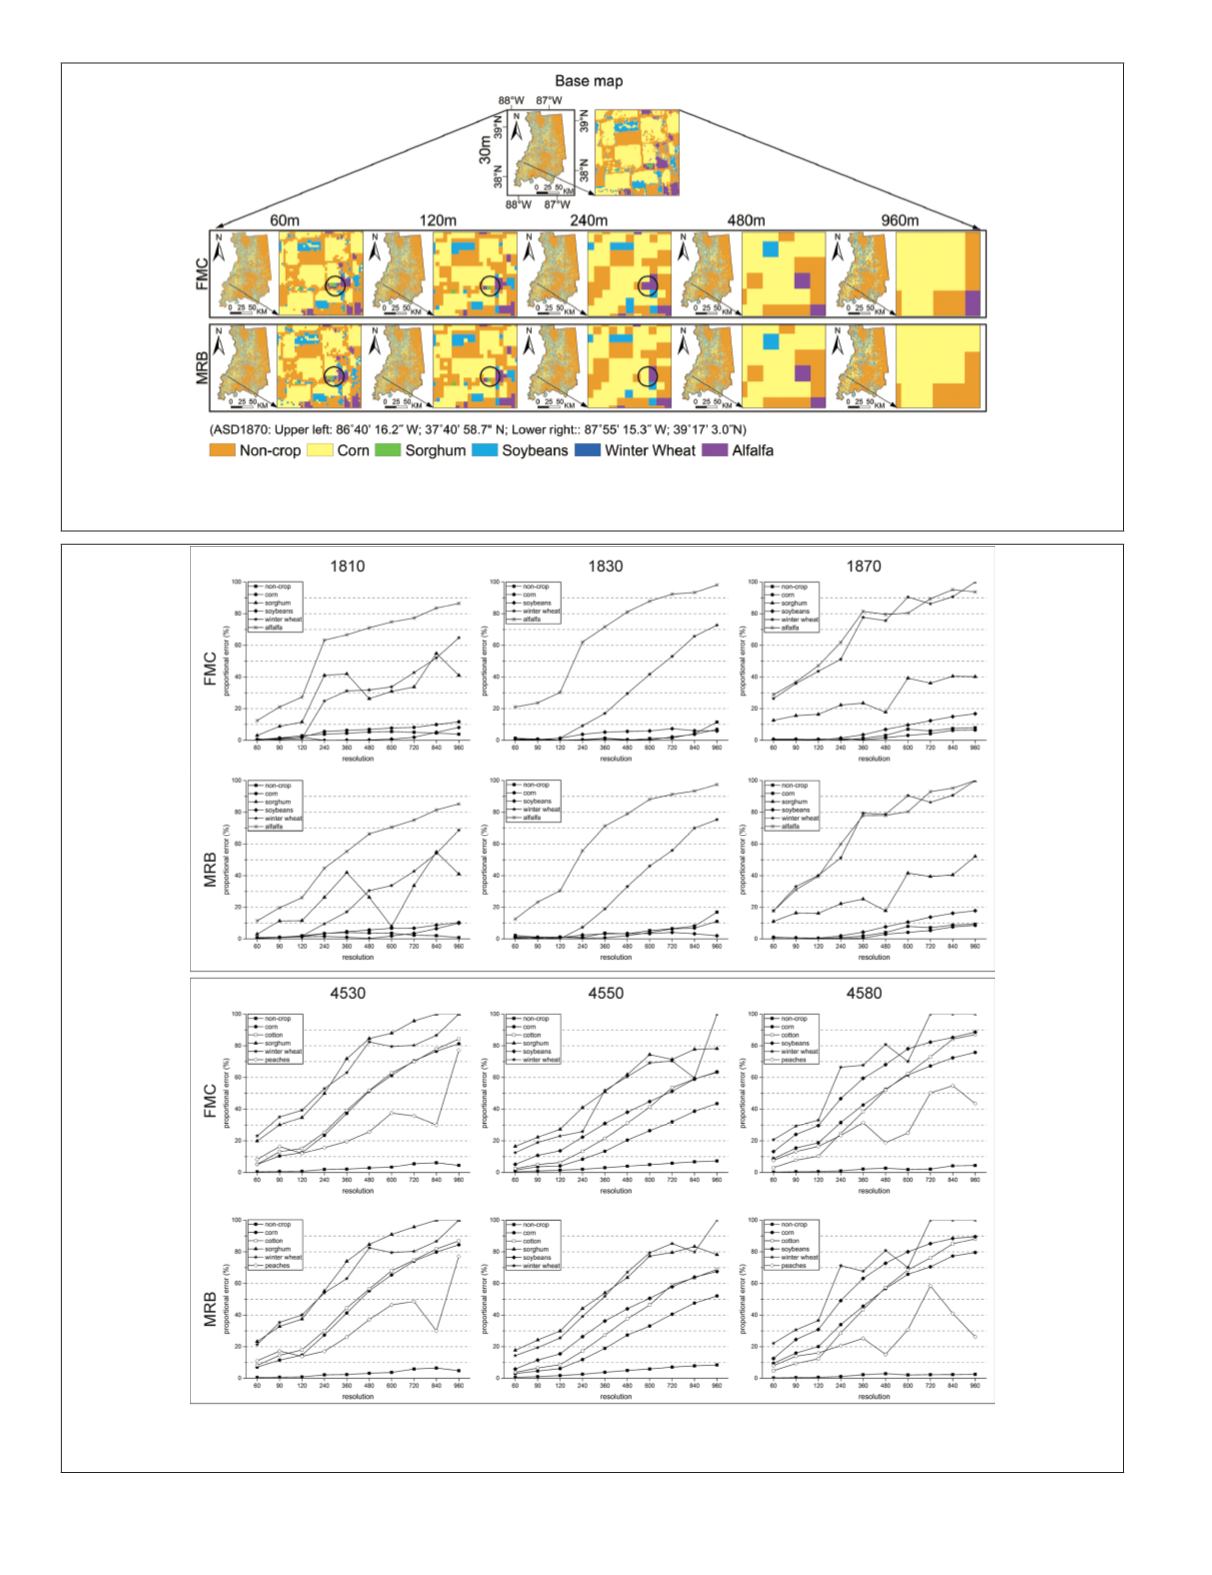
Figure 4. Upscaled maps at selected resolutions, which were produced by
FMC
and
MRB
(An example in
ASD
1870). The first
row represents the base map. The second row represents the results derived from
FMC
. The third row represents the results
derived from
MRB
.
Figure 5. Proportional errors of each class at each study area. The upper panel contains the results produced by
FMC
and
MRB
,
respectively, in relatively heterogeneous areas (i.e.,
ASD
1810, 1830 and 1870). The lower panel contains the results produced
by
FMC
and
MRB
, relatively, in homogeneous areas (i.e.,
ASD
4530, 4550, 4580).
94
February 2018
PHOTOGRAMMETRIC ENGINEERING & REMOTE SENSING


