Laser Scanner to Motor
For all introduced datasets, we executed our approach to
determine the offset between the timestamps of the laser scan-
ner and the motor that was previously presented. The results
are depicted in Table 2. We strove for the same accuracy as
shown in the previous subsection, and thus used the ranges
for the timestamp offset as depicted there.
The offsets presented are determined by evaluating the
two criteria previously introduced, namely the total number
of matches
n
and the average error per match
e
in the sweep
to map registration. After examining the results, we decided
to fit a second-degree polynomial to our data and determine
its extremum. It can be seen that both criteria lead to similar
results for all four datasets. Similar to our stationary method
that determines the timestamp offset prior to data acquisition,
the average offset over all four datasets amounts to 23.7 ms for
both criteria.
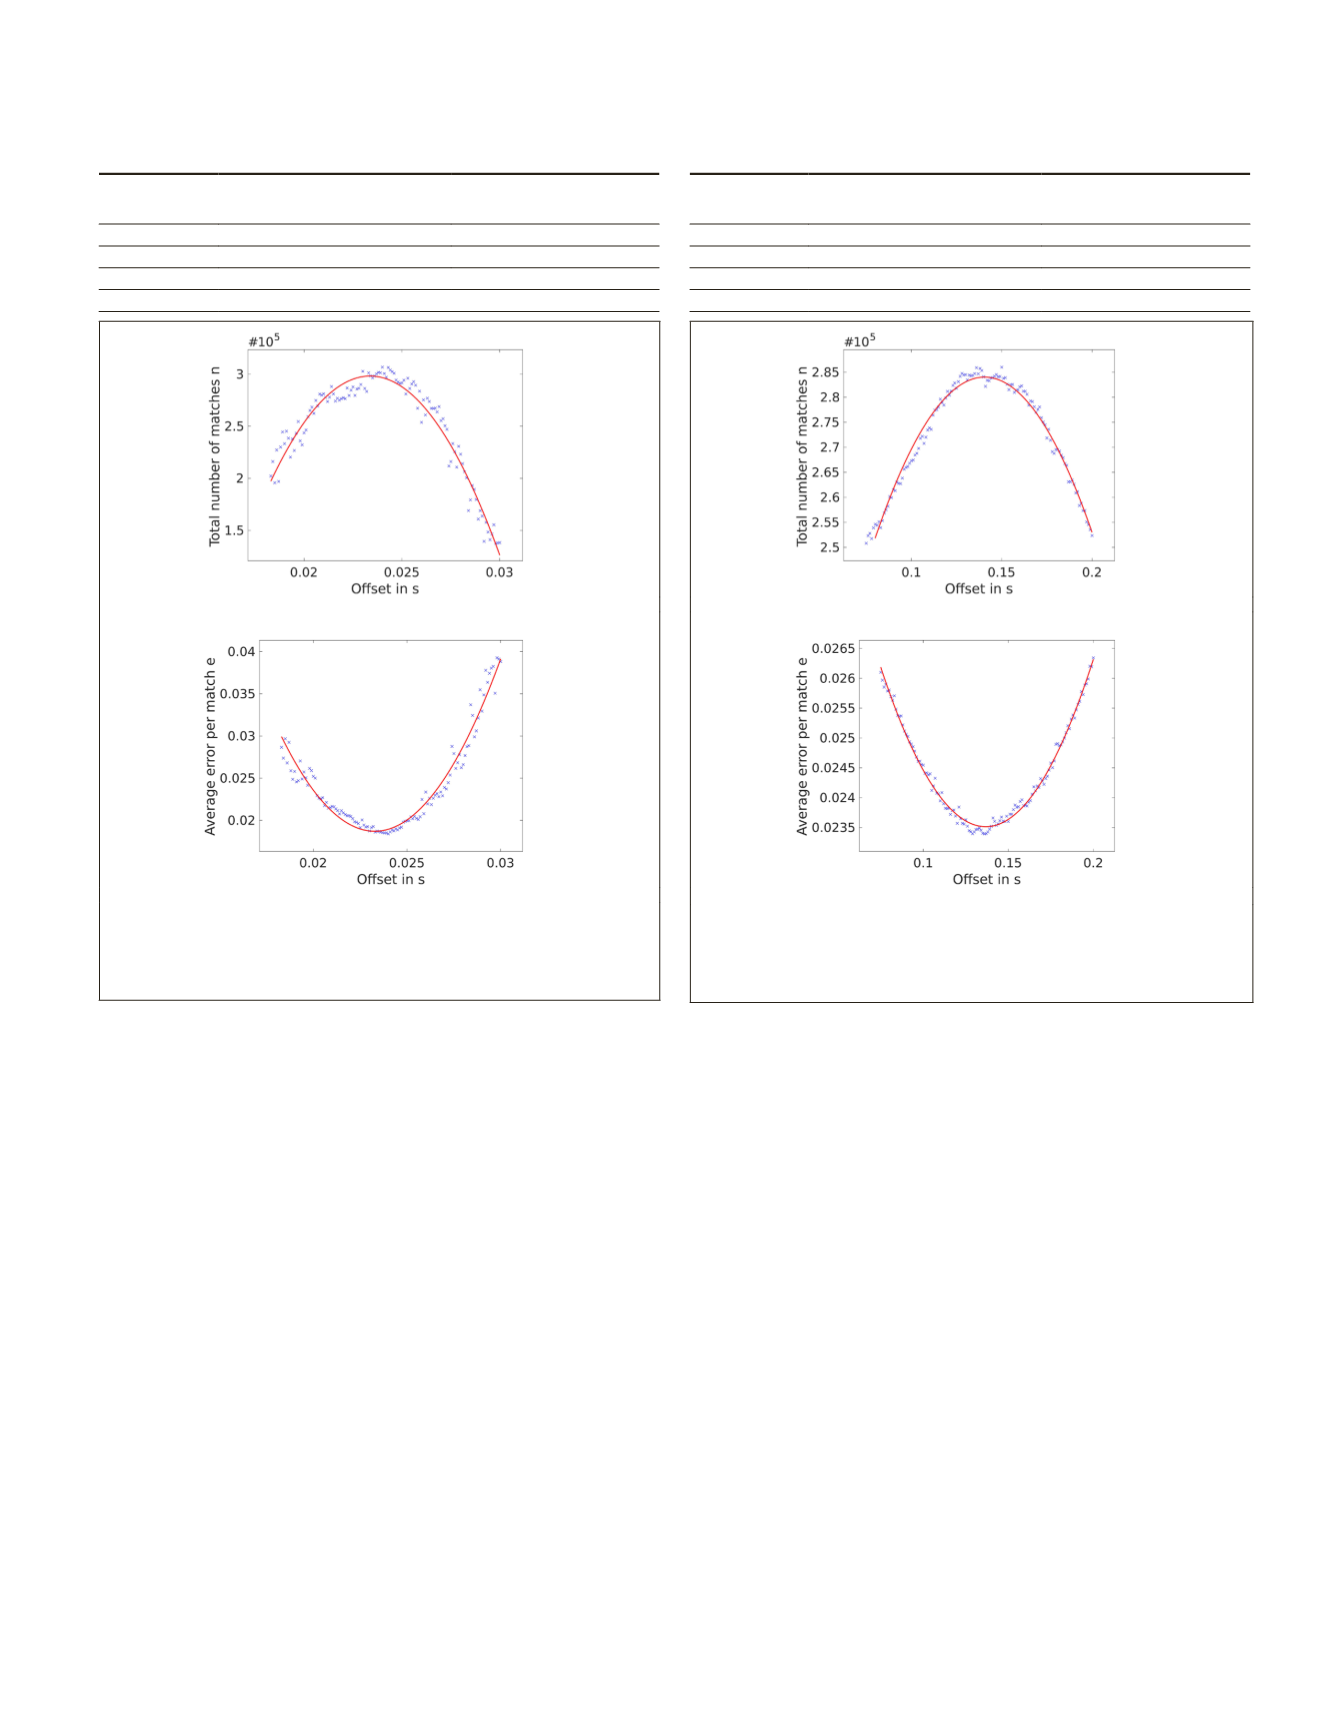
Figure 7 displays the measurement graphs for both criteria
evaluated on the parking area dataset. In Figure 7a it becomes
evident that the second-degree polynomial fitted to the total
number of matches
n
approaches its maximum at 23.8 ms. Simi-
larly, in Figure 7b it can be seen that the second-degree polyno-
mial fitted to the average error per match has its minimum at
23.7 ms.
Those two graphs are exemplary for all four datasets, and
thus it can be concluded that the timestamp offset has a great
effect on the quality of results produced by the presented
SLAM
approach. This can be observed by both the major drop
of the total number of matches
e
and the large growth of the
average error per match if the offset deviates by more than 3
ms from the extremum.
Laser Scanner to Camera
Similarly, we utilized our motion-based approach to deter-
mine the timestamp offset between laser scanner and camera.
After examining the data points computed by our approach,
we again decided to fit a second-degree polynomial to our
data. The relevant extrema are depicted in Table 3. For this
sensor combination we depict results with an accuracy of 1
ms since we did not see noteworthy improvements of both
criteria with an accuracy of 0.1 ms.
Figure 8 displays the measurement graphs for both criteria
evaluated on the metro station dataset. In Figure 8a it be-
comes evident that the second-degree polynomial fitted to the
total number of matches
n
approaches its maximum at 140
ms. Similarly, in Figure 8b, it can be seen that the second-de-
gree polynomial fitted to the average error per match
e
has its
minimum at 137 ms. Again, these two graphs are exemplary
for all four datasets, and thus show the relevance of an appro-
priate timestamp offset between laser scanner and camera.
Table 2. Results of the offset computation between laser
scanner and motor for all four datasets and for both criteria
that were introduced.
Dataset
Offset using the total
number of matches n [ms]
Offset using the average
error per match e [ms]
Metro station
23.9
24.1
Parking area
23.8
23.7
Cemetery
23.6
23.3
Lecture room
23.6
23.8
(a)
(b)
Figure 7. Measurement graphs for the timestamp offset
between laser scanner and motor for the parking area
dataset: (a) Total number of matches
n
, and (b) Average
error per match
e
.
Table 3. Results of the offset computation between laser
scanner and camera for all four datasets and for both criteria
that were introduced.
Dataset
Offset using the total
number of matches n [ms]
Offset using the average
error per match e [ms]
Metro station
140
137
Parking area
90
83
Cemetery
76
59
Lecture room
100
96
(a)
(b)
Figure 8. Measurement graphs for the timestamp offset
between laser scanner and camera for the metro station
dataset: (a) Total number of matches
n
, and (b) Average error
per match
e
.
PHOTOGRAMMETRIC ENGINEERING & REMOTE SENSING
June 2018
363


