weighted average of the eight neighboring pixels are used
to construct the level-1 input feature data :
Q SG x P x Q x P x Q x P x Q
ELM
T
ELM
T
SVM
T
SVM
T
KNN
T
KNN
T
_
,
,
,
,
,
( )
=
( )
( )
( )
( )
( )
x
P x P x P x
Q Q x Q x
T
ELM
ELM ELM
ELM ELM ELM
( )
(
)
( )
=
( )
( )
(
)
=
( )
( )
(
)
1
0
1
0
,
,
……
( )
=
( )
( )
(
)
( )
=
( )
( )
(
)
P x P x P x
Q x Q x Q x
KNN
KNN KNN
KNN
KNN KNN
1
0
1
0
,
,
(6)
where is the probability of the
ELM
output belonging to the
changed class, is the probability of the output belonging
to the unchanged class, and is the weighted average of the
eight neighboring pixels belonging to the changed class.
The other variables are obtained in a similar way.
2. Construction of the level-1 meta-classifier
After generating feature data , the
MRLR
is used as level-1
meta-classifier to predict all the results of the base classi-
fiers to obtain the initial change map according to . The
optimal parameters of the level-1 classifier are obtained
by using the remaining sub-training set and the two pa-
rameter optimization algorithms.
Object-based Constrained Change Detection
3. Segmentation of the stacked image
Multi-resolution segmentation is a commonly used seg-
mentation algorithm, which is a bottom-up approach that
combines adjacent pixels or small segmentation objects
to ensure a minimum average heterogeneity of different
objects and a maximum homogeneity of internal pixels.
4. Constraint of segmentation map
In order to make full use of spatial information in high-
resolution remote sensing images, we utilize spatial
information to eliminate some of the “salt-and-pepper”
noise and reduce the omission and commission ratio. The
over-segmentation of image will reduce the accuracy of
object-oriented change detection method. However, the
smaller scale segmentation object can reduce the omission
ratio when we use the segmentation object to constrain
the pixel-wise map. After obtaining the pixel-wise change
map using
SG
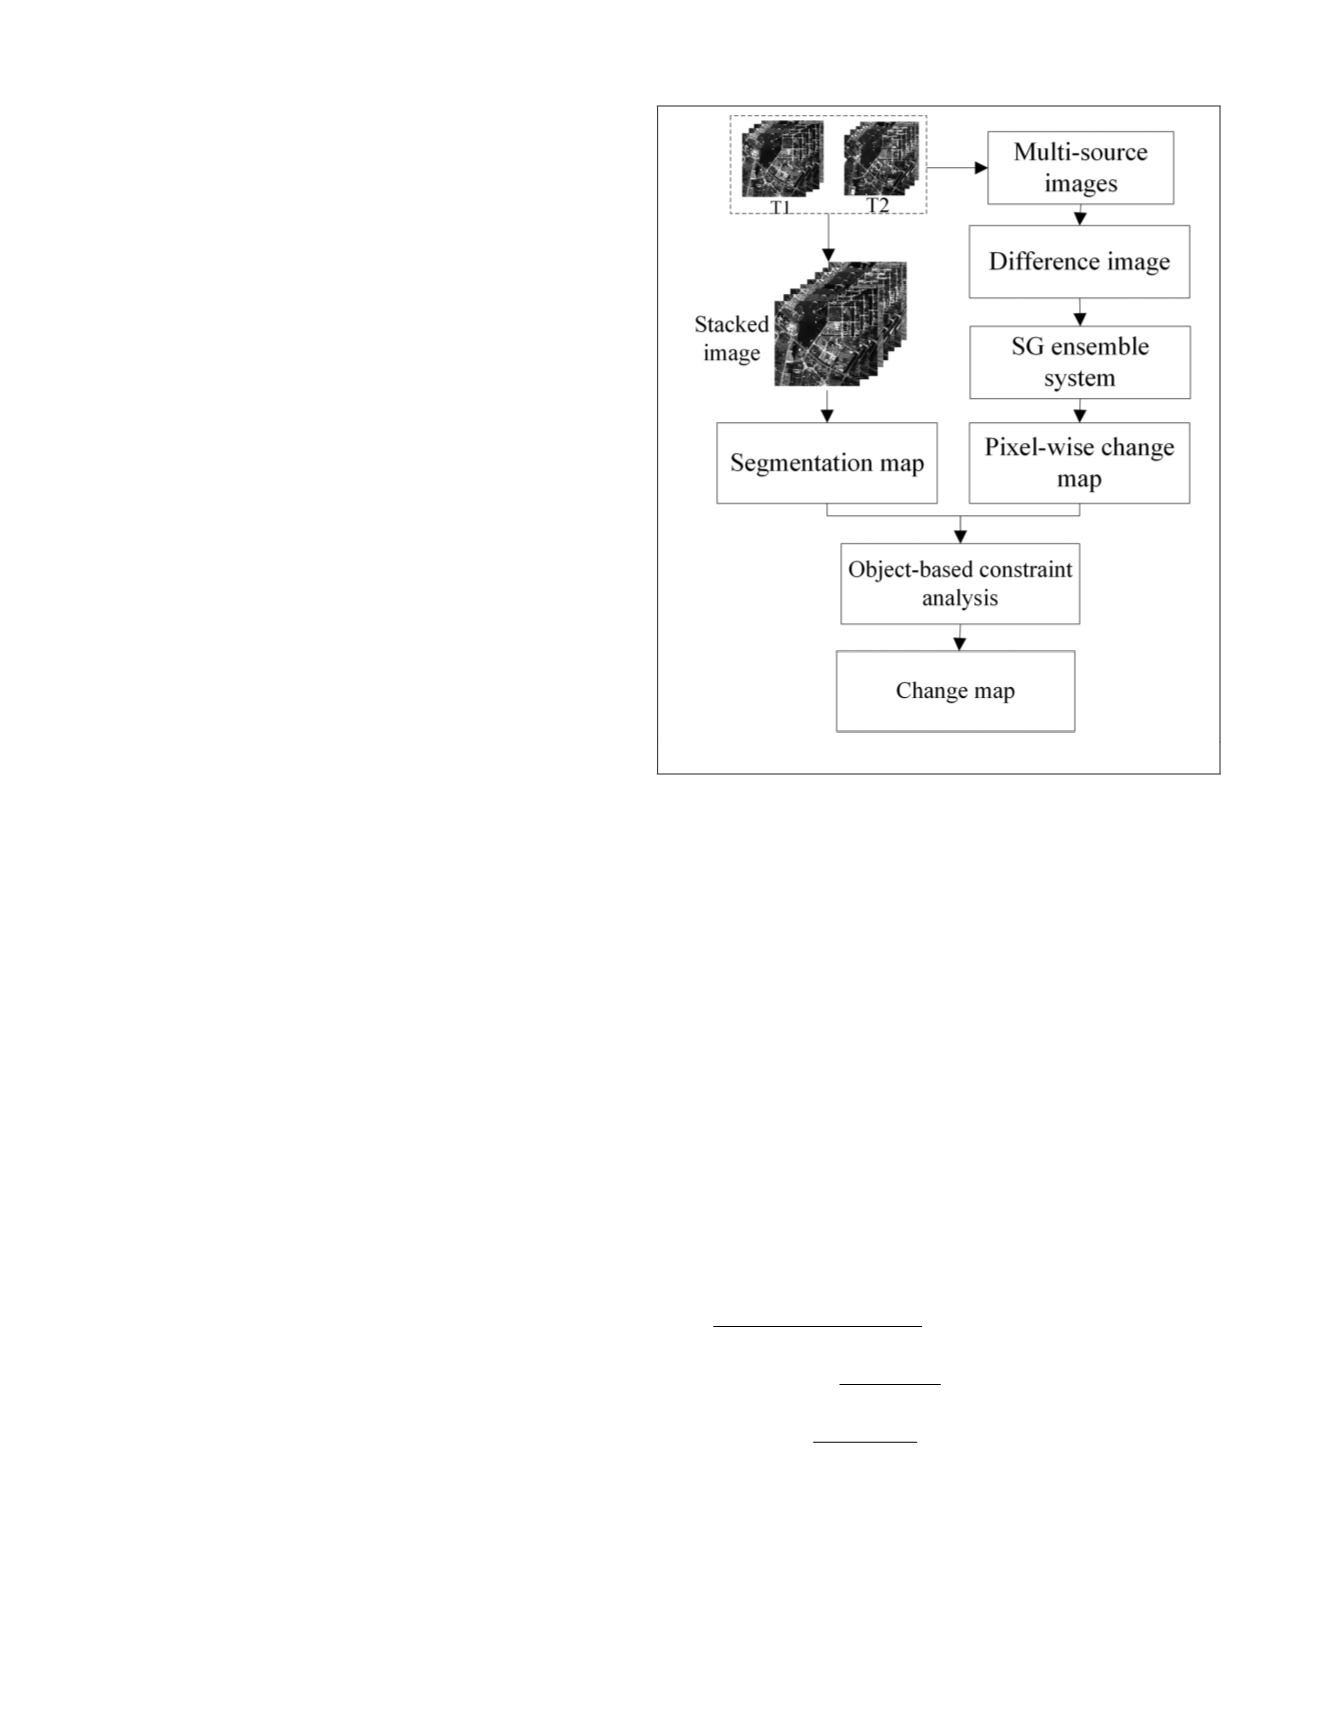
ensemble system and the segmentation map
segmented by multi-resolution, the ratio of change pixels
in each object in segmentation map is calculated. When
the ratio is less than the threshold
r,
the pixels in the ob-
ject are determined as unchanged pixels. The flowchart of
change detection based on the
SG
hybrid ensemble system
and segmentation map is shown in Figure 2.
Experiments and Analysis
Two multi-temporal and high-resolution remote sensing
datasets collected by the
ZY-3
satellite with spatial resolution
of 5.8 meters are used in the experiments.
ZY-3
is a Chinese
high-resolution imaging Earth observation satellite, launched
in January 2012. Both datasets have 450 × 450 pixels. The first
dataset (Figure 3) which is covered part of Yunlong District
consists of two high-resolution images of an area of Xuzhou
(Jiangsu Province, China), taken on 05 November 2012 and 04
November 2013, respectively. The two high-resolution images
(Figure 4) of the second dataset, covered part of Tongshan
District also located in Xuzhou, Jiangsu province, China, were
acquired in November, 2013 and October, 2014, respectively.
Image registration and radiometric correction are important
preprocessing steps before generating the difference maps.
The root mean square error of registration is less than 0.5
pixels. The relatively radiometric correction is performed by
linear regression analysis (Lo and Yang, 2000).
In order to analyze the effectiveness of the proposed
method, we compared our proposed method with pixel-wise
change detection methods (
PWCM
) (i.e.,
ELM
,
KNN
,
SVM
,
MLR
)
and object-based change detection methods (
OBCD
) (i.e.,
CVA
-
OB
,
ELM
-
OB
,
KNN
-
OB
,
SVM
-
OB
). In addition, the heterogeneous
ensemble algorithms (
HEAM
) of
MV
,
D-S
, and F_int were used
to extract the changes in both datasets. In order to demon-
strate the effectiveness of the
MRLR
as meta-classifier, the
SG
-
SVM
and
SG
-
MLR
were also implemented. We also compared
and analyzed the experimental results of the
MRLR
parameters
based on the
NNLS
and
FOA
. Except
SVM
,
KNN
,
MLR
,
CVA
-
OB
,
KNN
-
OB
, and
SVM
-
OB
, all the other methods were repeated 10
times. The accuracy of these methods was the average of 10
experimental results. The overall accuracy (
OA
), Commission
ratio and Omission ratio were used to evaluate the accuracy
of change detection by comparing the detection results with
the ground reference map, which are defined as
OA
N N
N N N N
Commissionratio
N
N N
=
+
+ + +
=
+
(
)
(
)
(
)
11 00
11 00 01 10
01
01 11
Omissionratio
N
N N
=
+
(
)
10
10 00
(7)
where
N
11
and
N
00
are the numbers of changed pixels and
unchanged pixels correctly detected, respectively,
N
10
is the
number of missed changed pixels, and
N
01
is the number of
Figure 2. Flowchart of change detection.
736
November 2018
PHOTOGRAMMETRIC ENGINEERING & REMOTE SENSING


