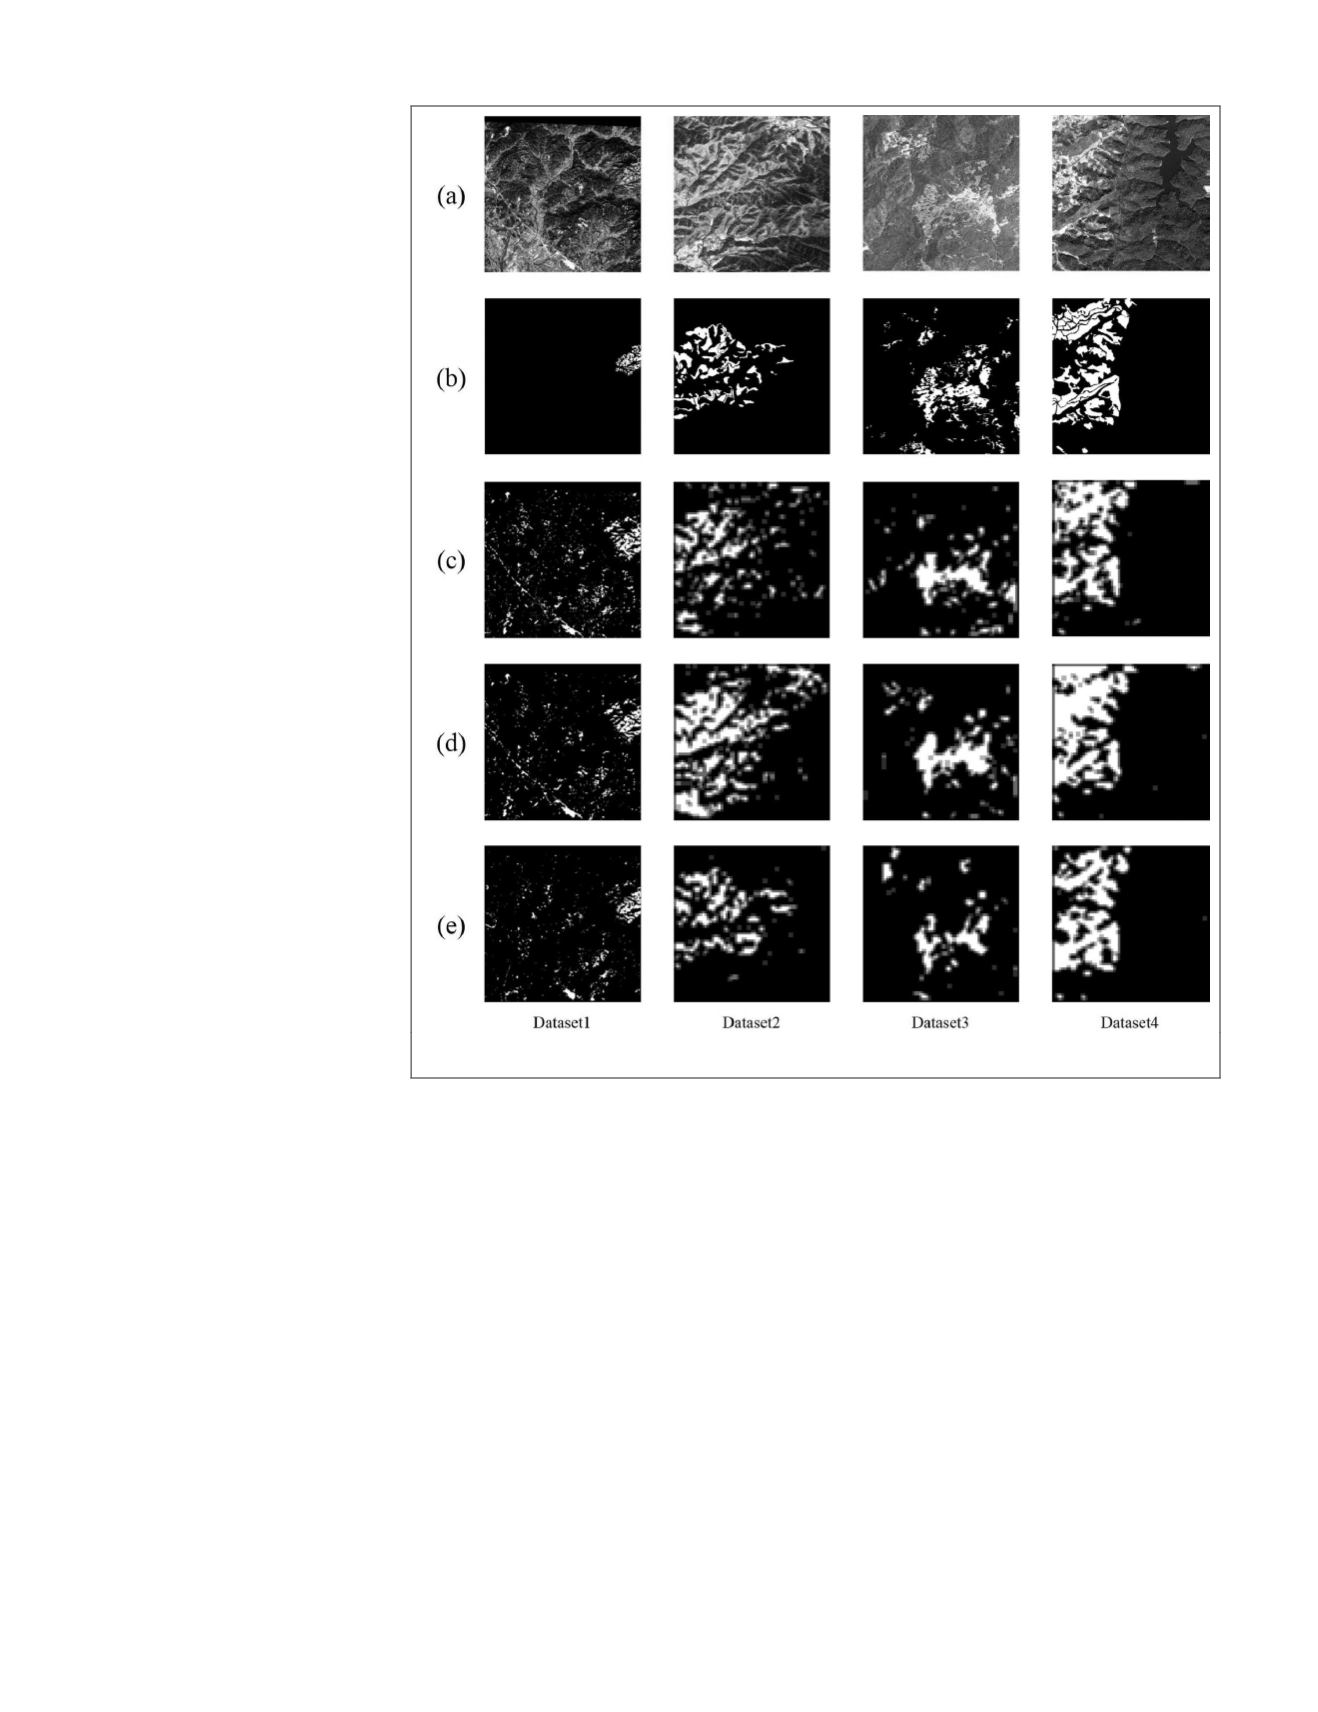
by four scenes. The brightness
of each unit is dependent on the
number of tea garden scenes in the
unit, i.e. the possibility of the unit
belonging to tea garden (the lighter
the unit, the higher the possibility
that it belongs to tea garden). As
shown in Figure 6, the results for
dataset 2, dataset 3, and dataset 4
are very close to the ground truth,
especially the maps derived from
the
UCNN
. On the maps of dataset
1, there is a higher false alarm rate.
The main reason for this is that the
lower resolution of dataset 1 results
in confusion between tea gardens
and sparse vegetation such as or-
chards and bushes.
Efficacy of Textural Features
The Kappa values of all the scene
classification methods with spec-
tral or spectral-textural features are
compared in Figure 8. In general,
it can be seen that the spectral-tex-
tural feature achieves comparable
or better results than the spectral
feature alone. For the
BOVW
and
sLDA
models, the spectral-textural
feature performs significantly bet-
ter than the spectral feature, and
the Kappa value increases by up
to 0.06. However, in terms of the
UCNN
, the addition of the textural
feature does not raise the classi-
fication accuracy, and the Kappa
value is even slightly decreased
in dataset 2. The addition of the
textural feature can improve the
performance of the topic models,
but it cannot enhance the
UCNN
.
This phenomenon shows that the
topic scene models are depen-
dent on the input features, but the
unsupervised feature learning can
adaptively produce suitable and
discriminative features from the
original data. There is therefore no need to include manually
designed features.
The visual results are shown in Figure 9, taking dataset 2
as an example. On the maps generated by
BOVW
, the consid-
eration of additional textural features effectively reduces the
false alarms when comparing Figure 9 (e) and (f). Figure 9 (d)
shows an example image of a false alarm (bare ground, not a
tea garden) in the result map of
BOVW
. It is incorrectly identi-
fied as a target using the spectral information alone, but is
correctly classified by the textural feature. On the other hand,
however, as for the
UCNN
model, the maps of the spectral
feature and spectral-textural feature are similar, and the ad-
dition of the textural information does not change the result.
As described in Li
et al.
(2016), the first and second layer
in the
UCNN
can automatically extract the structure features
such as edges, corners, and junctions, which can be regarded
as the composition of texture. It is shown that these features
extracted from the image by the
UCNN
are adequately dis-
criminative for tea garden identification and, hence, textural
features cannot increase the accuracy of the
UCNN
.
Comparison of Different Scene Classification Models
Figure 10 presents the best results (with spectral or spectral-
textural features) for each scene classification model in the
different datasets.
UCNN
achieves the best performance in all
the datasets, especially in dataset 2, which contains a large
amount of sparse vegetation. This phenomenon can also be
supported by Figure 11, which shows the best visual result of
each model in dataset 2. False alarms in the map of
BOVW
and
sLDA
can be observed, especially for
sLDA
. The classification
map of the
UCNN
is the closest to the reference. Although the
topic models have been proven to be very effective for scene
classification of remotely sensed images (Lienou
et al.
, 2010;
Huang
et al.
, 2015), they only achieve similar or slightly bet-
ter performances than
SVM
classification in tea garden detec-
tion. A possible reason for this is that the handcrafted features
which topic models depend on are not sufficient to represent
the semantic information (i.e., the spatial relationship of
sub-objects in the tea garden scenes). Instead, the
UCNN
, a
data-driven feature descriptor, can robustly characterize the
structure information and the spatial pattern of the tea planta-
tion, which determines the semantic category of tea garden.
Therefore, unsupervised feature learning based on the
UCNN
outperforms the topic models for tea garden detection.
Figure 6. The classification maps: (a) Raw image, (b) Ground truth, (c)
BOVW
(spectral-
textural), (d)
sLDA
(spectral-textural), and (e)
UCNN
(spectral).
728
November 2018
PHOTOGRAMMETRIC ENGINEERING & REMOTE SENSING


