function bases in the first and second layer, respectively.
The receptive field size
w
was set to 2, and the window
size
s
of the local pooling operation was set to 2. All pa-
rameters were determined according to the suggestions in
Li
et al.
(2016).
6.
SVM
: The plain linear
SVM
classifier, with the parameters
determined by 5-fold cross-validation, was utilized for the
scene classification. The training data comprised 20 tea
garden scenes and 20 non-tea garden scenes.
Results and Discussion
In this section, the accuracy assessment and visual results are
reported first. We then discuss the efficacy of the textual fea-
ture, and compare the different scene classification models.
Finally, we analyze the sensitivity of the scene size.
General Results
In this experiment, the classification was repeated using the
10 sets of samples for all the methods and the average Kappa
as well as its standard deviation was recorded, to assess the
performance. The results are presented in Table 2. It can be
seen that most of the Kappa values are higher than 0.80, ex-
cept for Original,
BOVW
, and
sLDA
in dataset 2. Moreover, the
optimal Kappa values of each dataset exceed 0.88 and are all
obtained by the
UCNN
. These results confirm the satisfactory
performance of the proposed scene-based framework for tea
garden detection, and the unsupervised feature learning based
UCNN
performs the best of all.
In order to show the detection results for the different
datasets visually, we present the classification maps in Figure
6 as well as a set of examples in Figure 7. The ground-truth
map for each dataset was manually delineated based on vi-
sual interpretation. In the classification maps, the scale of the
minimum processing unit is half of the scene size (30 m), due
to the overlapping, and in this way each unit can be covered
Table 1. Details of the datasets.
Study area
Tea
Data source
Resolution
Size
Time
Dataset1
Longyan
Oolong
WorldView-2
2m
4096×4096
2011/12
Dataset2
Longyan
Oolong
Google Earth
0.5m
4000×4000
2014/12
Dataset3
Hangzhou
Longjing
Google Earth
0.5m
4000×4000
2016/07
Dataset4
Puer
Puer
Google Earth
0.5m
4000×4000
2016/02
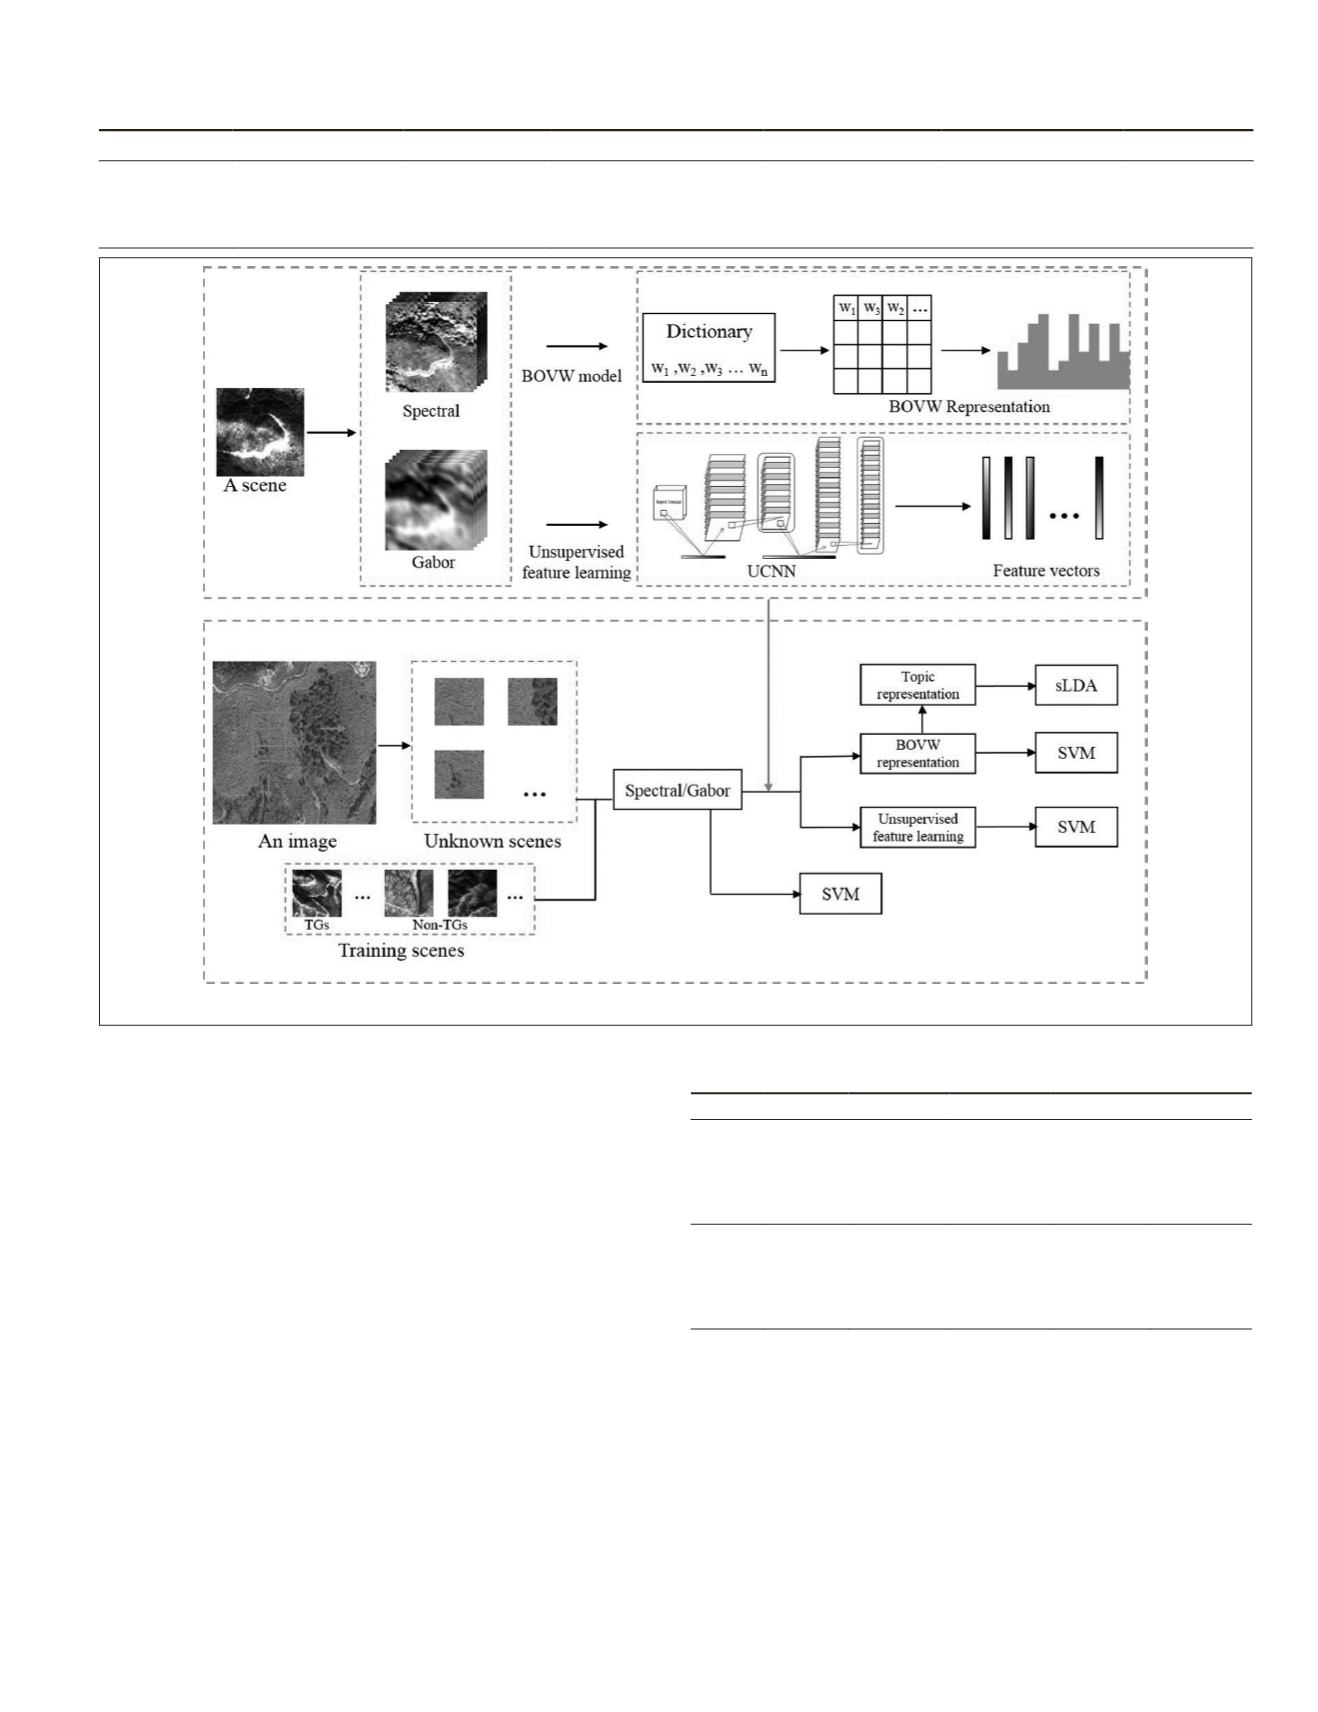
Figure 5. The proposed scene-based tea garden detection framework.
Table 2. Classification accuracy (Original = SVM classification
directly using the spectral or spectral-textural features).
Dataset1 Dataset2 Dataset3 Dataset4
Spectral
Original 0.84±0.04 0.75±0.06 0.88±0.04 0.95±0.02
BOVW 0.81±0.06 0.74±0.04 0.90±0.03 0.89±0.04
sLDA 0.85±0.02 0.74±0.04 0.91±0.03 0.90±0.02
UCNN
0.88
±0.04
0.91
±0.04
0.94
±0.03
0.98
±0.01
Spectral-
Textural
Original 0.85±0.03 0.75±0.06 0.88±0.05 0.95±0.02
BOVW 0.83±0.03 0.78±0.03 0.92±0.03 0.95±0.02
sLDA 0.86±0.02 0.79±0.04 0.93±0.03 0.95±0.01
UCNN
0.88
±0.03
0.88
±0.05
0.96
±0.02
0.98
±0.01
PHOTOGRAMMETRIC ENGINEERING & REMOTE SENSING
November 2018
727


