Worth metropolitan area). Larger versions showing the full
extents of the 1986-2006
AASG
classifications are shown in
Figures S4-S8. The updated classifications all clearly repro-
duce the broad spatial patterns characteristic of the Southeast
(Figure 3a, 3b, and 3c and Figures S4-S8). Cultivated cropland
is widespread around the Mississippi River, southern Illinois
and Indiana, central Kansas and Oklahoma, and the Atlantic
coastal plain. Moving west from the Mississippi, there is also
a clear transition from predominantly forested ecosystems to
grassland/herbaceous and shrub/scrub ecosystems in Kansas,
Oklahoma, and Texas.
Comparison of our classified maps for years 2001 and 2006
to the withheld
NLCD
maps for 2001 and 2006 demonstrates
good agreement between the two products (Tables 1 and
S3-S4). When excluding any pixels classified as “Developed,
Open Space” by
NLCD
, the fractions of Southeast land area
assigned to each class were remarkably similar between the
two products. The largest differences occur for the spectrally-
similar grassland/herbaceous and hay/pasture classes, where
our
AASG
product tended to overclassify hay/pasture and
underclassify grassland/herbaceous relative to the
NLCD
. Over-
all pixel-by-pixel agreement between the two products was
about 76% in 2001 and 73% in 2006, with particularly high
agreement on water (>90%), deciduous forest (>80%), and
cultivated crops (>80%). The highest disagreement between
the two products occurred for land cover classes that reflect
gradients (e.g., low- to high-intensity developed), mixtures of
more general classes (e.g., mixed forest), or between classes
with spectrally- or functionally-similar characteristics (e.g.,
among woody classes and among herbaceous classes) (Tables
S3-S4). Generalizing the classification to a simpler set of
categories – with developed, woody, and herbaceous classes
each aggregated into one general class – resulted in much
higher overall agreement between the
AASG
and
NLCD
classifi-
cations (85-87%; Tables 2 and S5-S6), with
PA*
and
UA*
>70%
for every category except barren land, which was the least
prevalent of the classes (<0.5% of land area).
The independent accuracy assessments further confirm the
consistency of the
AASG
and
NLCD
products, and show that
AASG
is capable of mapping land cover with high accuracy
over large regions. Considering only the best possible refer-
ence class label,
AASG
achieved overall accuracies of 80.8-
82.9% (±3.4-3.6%) for the 1996-2006 classifications (Tables
3 and S7-S9), which were statistically indistinguishable
from the
NLCD
accuracies at the same sample points (Tables
3 and S10-S11).
AASG
performed particularly well for water
and woody vegetation classes, with PA and UA greater than
77% for water and greater than 86% for woody vegetation
in all three years (Table 3). The least prevalent class (barren
land), on the other hand, was poorly mapped, with PA less
than 15% and UA less than 67% across all three years due to
confusion with developed land, turbid water, low density her-
baceous vegetation, and fallow cropland (Tables S7-S9). When
allowing any acceptable class label, the overall accuracies
of the
AASG
classifications increased to approximately 92%
(±2.4-2.6%) (Tables 4 and S12-S14), which were also statisti-
cally indistinguishable from the
NLCD
accuracies (Tables 4
and S15-S16). Both
AASG
and
NLCD
were particularly adept at
classifying water, woody vegetation, herbaceous vegetation,
and cultivated crops, which each achieved PA and UA of at
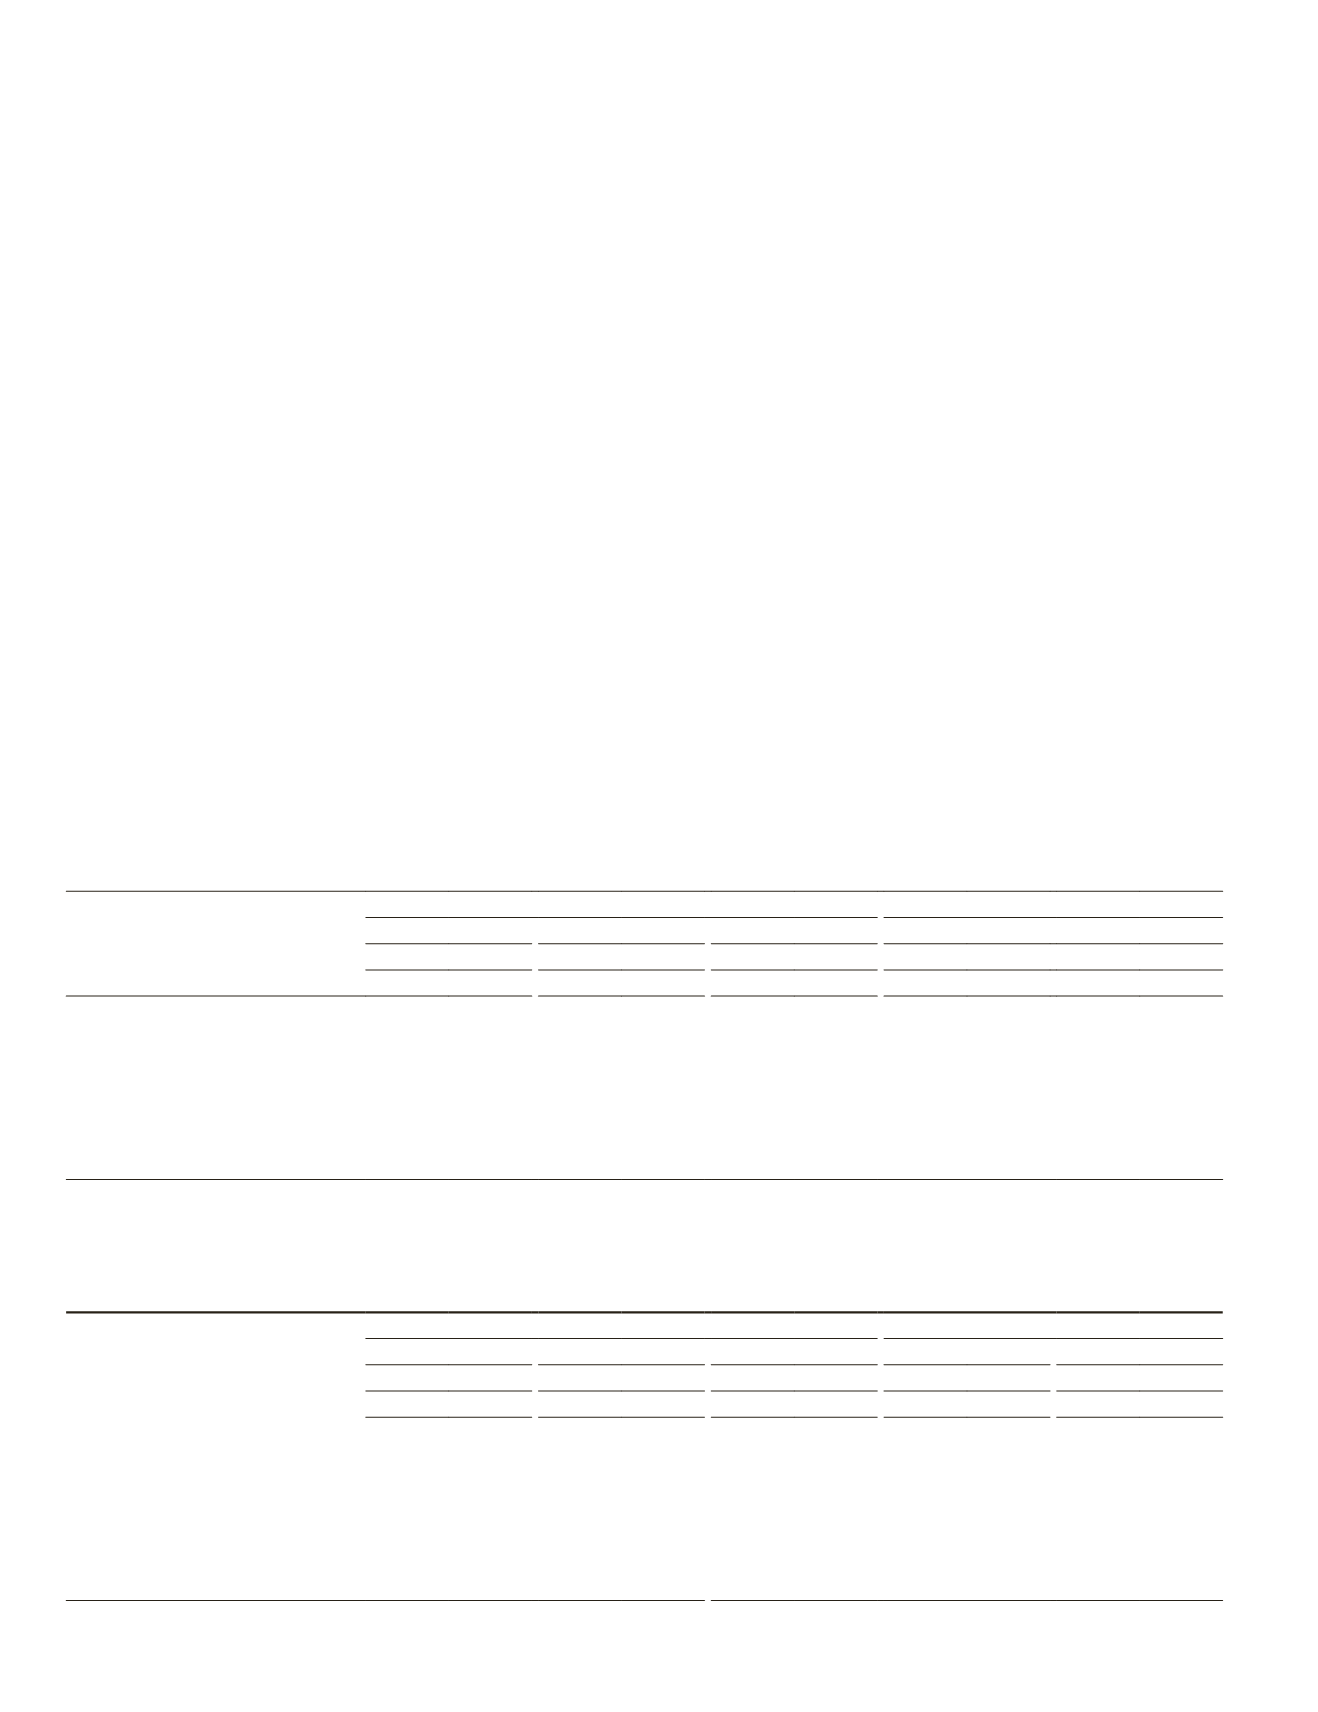
Table 3. Overall accuracy (
OA
) with 95% confidence interval (estimated as 1.96×
SE
), user’s accuracy (
UA
), and producer’s
accuracy (
PA
) for simplified 1996-2006
AASG
and
NLCD
classifications based on the
BEST
possible reference class label. For
NLCD
,
reference points that were classified as “Developed, Open Space” were excluded from the assessment. For class labels, numbers
in parentheses indicate which Anderson Level 2 classes (see Figure 1 for full class labels) were included within each of the
aggregated classes.
AASG
NLCD
2006
2001
1996
2006
2001
OA = 82.9% ± 3.5% OA = 80.8% ± 3.6% OA = 82.3% ± 3.4% OA = 78.0% ± 4.0% OA = 76.9% ± 4.0%
Class
PA UA
PA UA
PA UA
PA UA
PA UA
Water (11)
89.4% 93.2% 77.3% 95.2% 85.0% 93.4% 85.1% 87.0% 74.0% 88.2%
Developed (22, 23, 24)
89.4% 60.7% 61.5% 71.7% 51.2% 67.4% 66.3% 71.4% 64.5% 84.4%
Barren (31)
14.3% 51.0% 13.7% 63.0% 11.3% 66.7% 6.9% 57.1% 17.1% 63.3%
Woody vegetation (41, 42, 43, 52, 90) 92.2% 91.2% 95.2% 86.3% 89.9% 92.5% 94.3% 82.8% 93.1% 82.1%
Herbaceous vegetation (71, 81)
71.2% 75.3% 71.0% 75.3% 76.9% 67.6% 67.3% 69.0% 64.1% 65.7%
Cultivated crops (82)
75.1% 74.7% 72.8% 70.4% 80.3% 74.6% 70.7% 76.1% 65.5% 70.6%
Emergent herbaceous wetland (95)
70.5% 64.8% 54.0% 80.9% 94.3% 76.5% 41.2% 69.0% 46.9% 80.5%
Table 4. Overall accuracy (
OA
) with 95% confidence interval (estimated as 1.
96×SE
), user’s accuracy (
UA
), and producer’s
accuracy (
PA
) for simplified 1996-2006
AASG
and
NLCD
classifications based on any
ACCEPTABLE
class label. For
NLCD
, reference
points that were classified as “Developed, Open Space” were excluded from the assessment. For class labels, numbers
in parentheses indicate which Anderson Level 2 classes (see Fig. 1 for full class labels) were included within each of the
aggregated classes.
AASG
NLCD
2006
2001
1996
2006
2001
OA = 92.0% ± 2.6% OA = 92.8% ± 2.4% OA = 92.4% ± 2.4% OA = 88.9% ± 3.1% OA = 90.3% ± 2.9%
Class
PA UA
PA UA
PA UA
PA UA
PA UA
Water (11)
94.4% 96.6% 86.0% 100.0% 92.7% 98.4% 95.2% 91.3% 87.7% 94.1%
Developed (22, 23, 24)
97.9% 76.8% 82.6% 80.4% 70.3% 76.7% 78.9% 85.7% 89.2% 96.9%
Barren (31)
49.4% 65.3% 25.9% 88.9% 18.4% 76.2% 10.5% 67.9% 22.4% 80.0%
Woody vegetation (41, 42, 43, 52, 90) 95.9% 93.2% 98.3% 92.9% 94.4% 96.6% 97.6% 87.0% 97.5% 88.4%
Herbaceous vegetation (71, 81)
85.2% 94.8% 90.6% 94.8% 92.2% 88.2% 86.3% 92.0% 88.2% 91.2%
Cultivated crops (82)
92.5% 88.6% 93.3% 90.1% 97.3% 88.1% 86.9% 92.5% 85.8% 92.6%
Emergent herbaceous wetland (95)
77.5% 77.8% 67.2% 95.7% 95.2% 92.2% 54.3% 78.6% 57.1% 92.7%
564
September 2018
PHOTOGRAMMETRIC ENGINEERING & REMOTE SENSING


