H
i
=
aX
i
+
bY
i
+
c
(4)
N
is the total number of the neighborhood points, and we
choose
N
= 9. By using the neighborhood points and Equa-
tion 4, the coefficients
a
and
b
can be calculated using LSM
(Least Square Method). In Equation 2, tan
Sx
=
a
, tan
Sy
=
b
,
Sx
and
Sy
mean the terrain slope along
X
and
Y
directions,
respectively, and
S
is the total slope value. In Equation 3,
ξ
is the roughness; and the
H
DEM_i
is the elevation value of the
existing public DSM grid, and
H
i
is the calculated value using
Equation 4.
Registration Between Stereo Images and Laser Data
According to the direct geo-location accuracy of ZY3 satellite
images, which is approximately 15 m after on-orbit geometric
calibration (Wang
et al
., 2014; Tang
et al
., 2015), it is dif-
ficult to register the satellite laser altimetry data with the
stereo images by using back-projection directly, and the error
maybe several or even ten pixels. As previously mentioned ,
although the footprint size is almost 75 m, the selected laser
points locate on the small slope and roughness, so the eleva-
tion has coherence and can meet the accuracy requirement of
elevation control for 1:50 000 mapping. Then, the registration
between the laser data and stereo images can be transformed
into image-to-image matching restricted to the circle of the
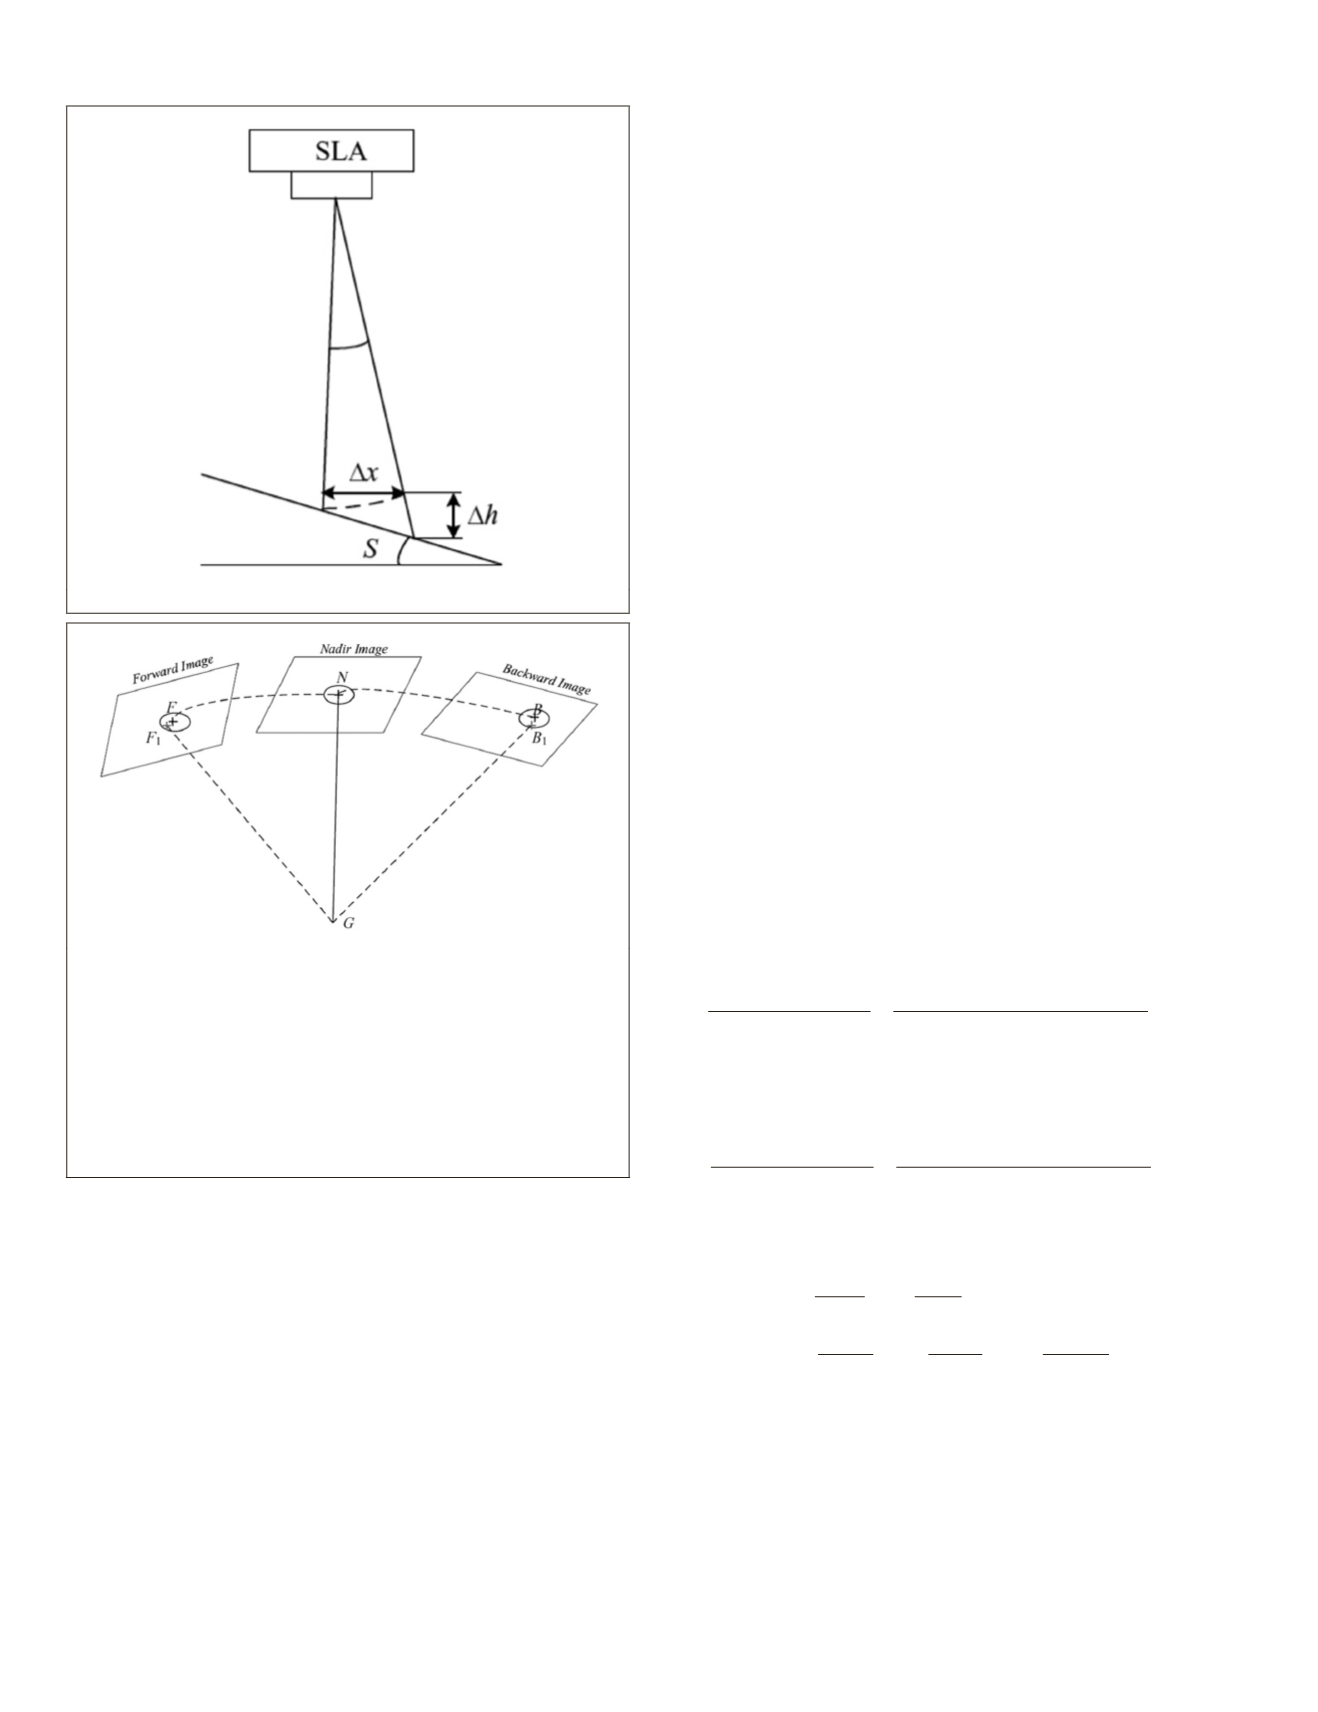
laser footprint point, which is shown in Figure 5.
The deviation of the image coordinates in the forward and
backward images from the direct back-projection of the same
laser point is inherent due to the error source. However, the
laser pointing direction of
ZY3-02
is almost parallel to the na-
dir viewing camera, so the back-projection to the nadir image
of the laser point can be viewed as the image position of the
laser point, then the nadir image is viewed as reference, and
the tri-images matching among the forward, backward, and
nadir images is implemented to obtain the corresponding im-
age point as the laser footprint located on the stereo images.
The elevation coordinate is derived from the laser eleva-
tion control point, which is almost flat after being selected
based on the small terrain slope and roughness. In order to
ensure the total validity between laser footprint point and
stereo images, the manual selection of corresponding points
is implemented, which can reach to better than 0.5 pixel. If
the corresponding point is difficult to select as the elevation
control point, it will be rejected.
Combined Adjustment of Satellite Stereo Images and Laser Data
Adjustment with
RFM
and Elevation Constraint (
RFM
_EC)
In this paper, the
ZY3-02
SLA
data are viewed as the elevation
control for the stereo images to improve the elevation accu-
racy without
GCPs
. Because the stereo images are distributed
and published as sensor corrected (
SC
) (Pan
et al
., 2013; Li
et
al
., 2014) with rational polynomial coefficients (
RPCs
)) based
on the rational function model (
RFM
), then the processing is
combined adjustment using the
RFM
(Grodecki and Dial, 2003;
Tong
et al
., 2010; Teo, 2011). The
RFM
is very common for
HRSI
, which can be simply described as follows:
(
)
r
Num H
Den
H
p
n
S n n n
S n n n
ijk
k
j
j
i
i
n
i j
=
(
)
(
)
=
= = =
− −
∑∑∑
φ λ
φ λ
φ
, ,
, ,
1
0 0 0
3
k
n
j k
n
k
ijk
k
j
j
i
i
n
i j k
n
j k
n
k
n
L n n
H
p
H
c
Num
λ
φ λ
φ λ
−
= = =
− − −
∑∑∑
=
2
0 0 0
3
, ,
H
Den
H
p
H
p
n
L n n n
ijk
k
j
j
i
i
n
i j k
n
j k
n
k
i
(
)
=
= = =
− − −
∑∑∑
φ λ
φ λ
, ,
3
0 0 0
3
4
jk
k
j
j
i
i
n
i j k
n
j k
n
k
H
= = =
− − −
∑∑∑
0 0 0
3
φ λ
(5)
c
c c
c
r
r r
r
H
H H
H
n
s
n
s
n
s
n
s
n
s
=
−
=
−
=
−
=
−
=
−
0
0
0
0
0
,
,
,
φ φ φ
φ
λ λ λ
λ
(6)
where, (
φ
,
λ
,
H
) is the object space coordinate and (
c
,
r
) is the
image space coordinate of the corresponding point. (
φ
n
,
λ
n
,
H
n
)
and (
c
n
,
r
n
) are the normalized object and image space coordi-
nates of the point, (
c
0
,
r
0
) and (
φ
0
,
λ
0
,
H
0
) are the offset param-
eters, and (
c
s
,
r
s
) and (
φ
s
,
λ
s
,
H
s
) are the scaling parameters.
p
1
ijk
,
p
2
ijk
,
p
3
ijk
,
p
4
ijk
are the standard
RPCs
.
When implementing the combined adjustment of stereo
images and laser altimetry data, the
RFM
compensated model
Figure 4. Elevation derivation due to terrain slope.
Figure 5. Registration between the stereo images and laser
altimetry point of
ZY3-02
satellite. Forward image is on
the left, nadir image in the middle, and backward image
on the right. Point
G
represents the laser footprint point
on the ground, and the black point
N
in the nadir image
is calculated using the back-projection of laser point
coordinates directly. Image points
F
and
B
in gray are image
matching result viewing the nadir image as reference, and
the points
F
1
and
B
1
in gray are not the corresponding points
just using the direct back-projection from
G.
572
September 2018
PHOTOGRAMMETRIC ENGINEERING & REMOTE SENSING


