Accuracy Validation of DSM
Apart from the above experiment, the elevation accuracy of
DSM
derived from
ZY3-02
satellite stereo images before and
after combined adjustment was validated and compared us-
ing the
GLAS
laser data. We chose one scene of
ZY3-02
satel-
lite stereo images from the third test region, which is the
SC
product with standard
RPCs
. The original
DSM
was generated
using the original
RPCs
and density image matching (Pab-
lo,2013; Zhang and Gruen, 2006). The combined adjustment
was implemented as described in the Combined Adjustment
of Laser Altimetry Data and Stereo Images Section using the
ZY3-02
laser altimetry data as the elevation control point, and
the new
DSM
produced based on the compensated
RPCs
after
adjustment and the same density image matching strategy.
Owing to the much higher density and accuracy of the
GLAS
data, it was used as reference to validate the
DSM
result. The
distribution of
DSM
,
ZY3-02
laser data, and
GLAS
data is illus-
trated in Figure 9.
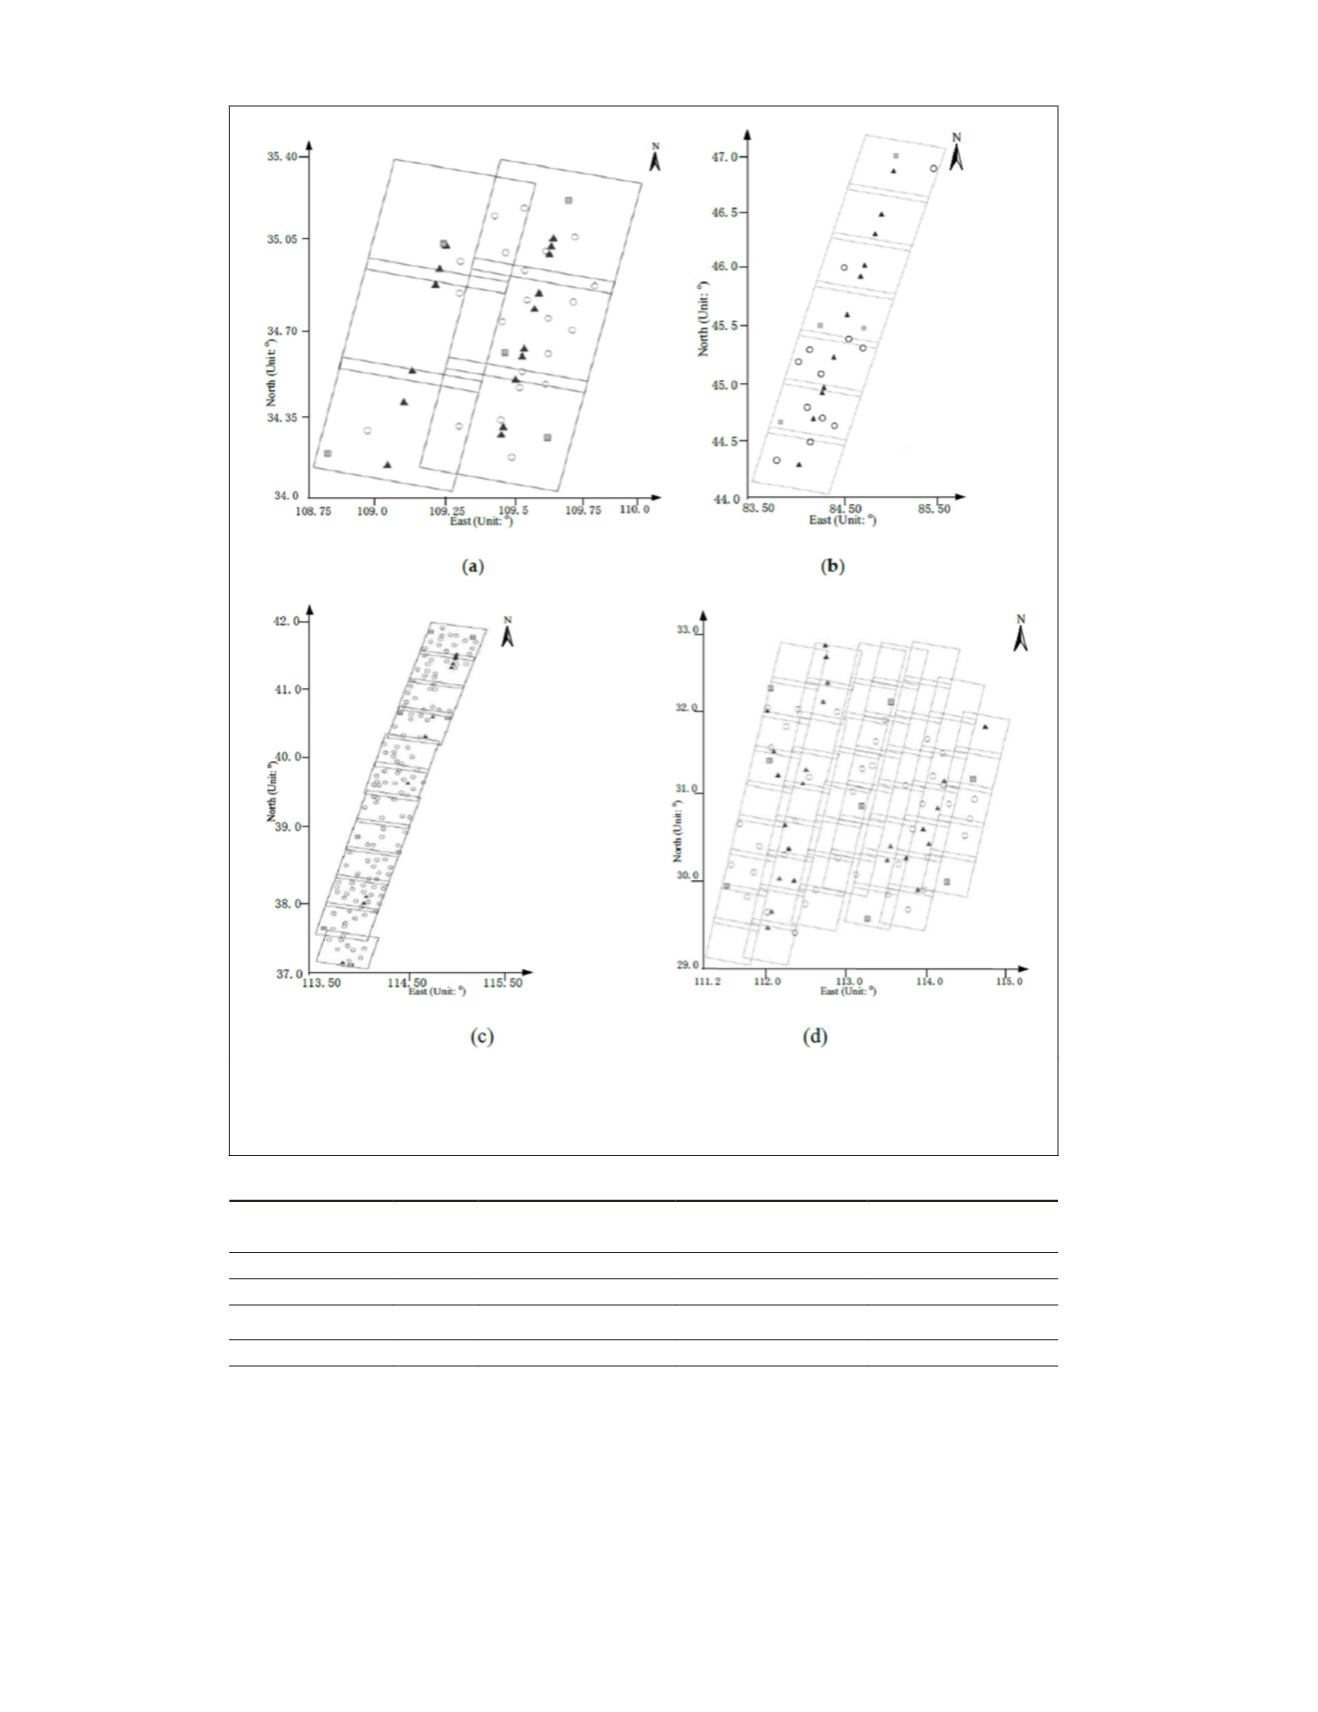
Figure 7. Distribution of different kinds of points in four experimental regions: (a)
Weinan of Shaanxi; (b) Kelamayi of Xinjiang; (c)Wutai of Shanxi; and (d) Suizhou of
Hubei. White circle is the check point, triangle is the elevation point derived from
SLA
or
GLAS
laser data, and square represents the horizontal control point.
Table 4. Different combinations of variety points in the adjustment.
Location
Number
of CPs
Number of SLAs in
elevation control (V)
Number of horizontal
controls (H)
Combined adjustment
method
Weinan, Shaanxi
27
16
5
RFM_EC and RSM_RC
Kelamayi, Xinjiang 16
11
4
RFM_EC and RSM_RC
Laiyuan, Hebei
140
11
8
RFM_EC
Suizhou, Hubei
48 13(ZY3-02)+11(GLAS)
8
RFM_EC
574
September 2018
PHOTOGRAMMETRIC ENGINEERING & REMOTE SENSING


