were developed using 75 randomly selected points from the
fractional cover dataset using software R with default settings.
The regression tree models were then validated against the
remaining dataset (82 points).
Google Earth Visual Transects and Data from the Literature
Growing season images (i.e., 9 March 2004, 27 February 2010,
and 23 April 2007) were acquired from Google Earth Pro are
© 2017 DigitalGlobe. A total of 100 validation sites, each the
size of a
MODIS
pixel, were also selected from Google Earth,
and the fractional covers of herbaceous
and woody vegetation within these points
were estimated. The sites scattered across
ecoregions (ER)1, ER4, and ER7, represent-
ing diverse vegetation cover ranging from
dense woodland to grassland with a variety
of species combinations. A total of 80
equally spaced sampling points along four
transects (Figure 6) within the sampling
site were used to count their corresponding
cover types (i.e., woody, herbaceous, and
others). Green woody and green herbaceous
fractional covers within each site were cal-
culated from these observations.
Results
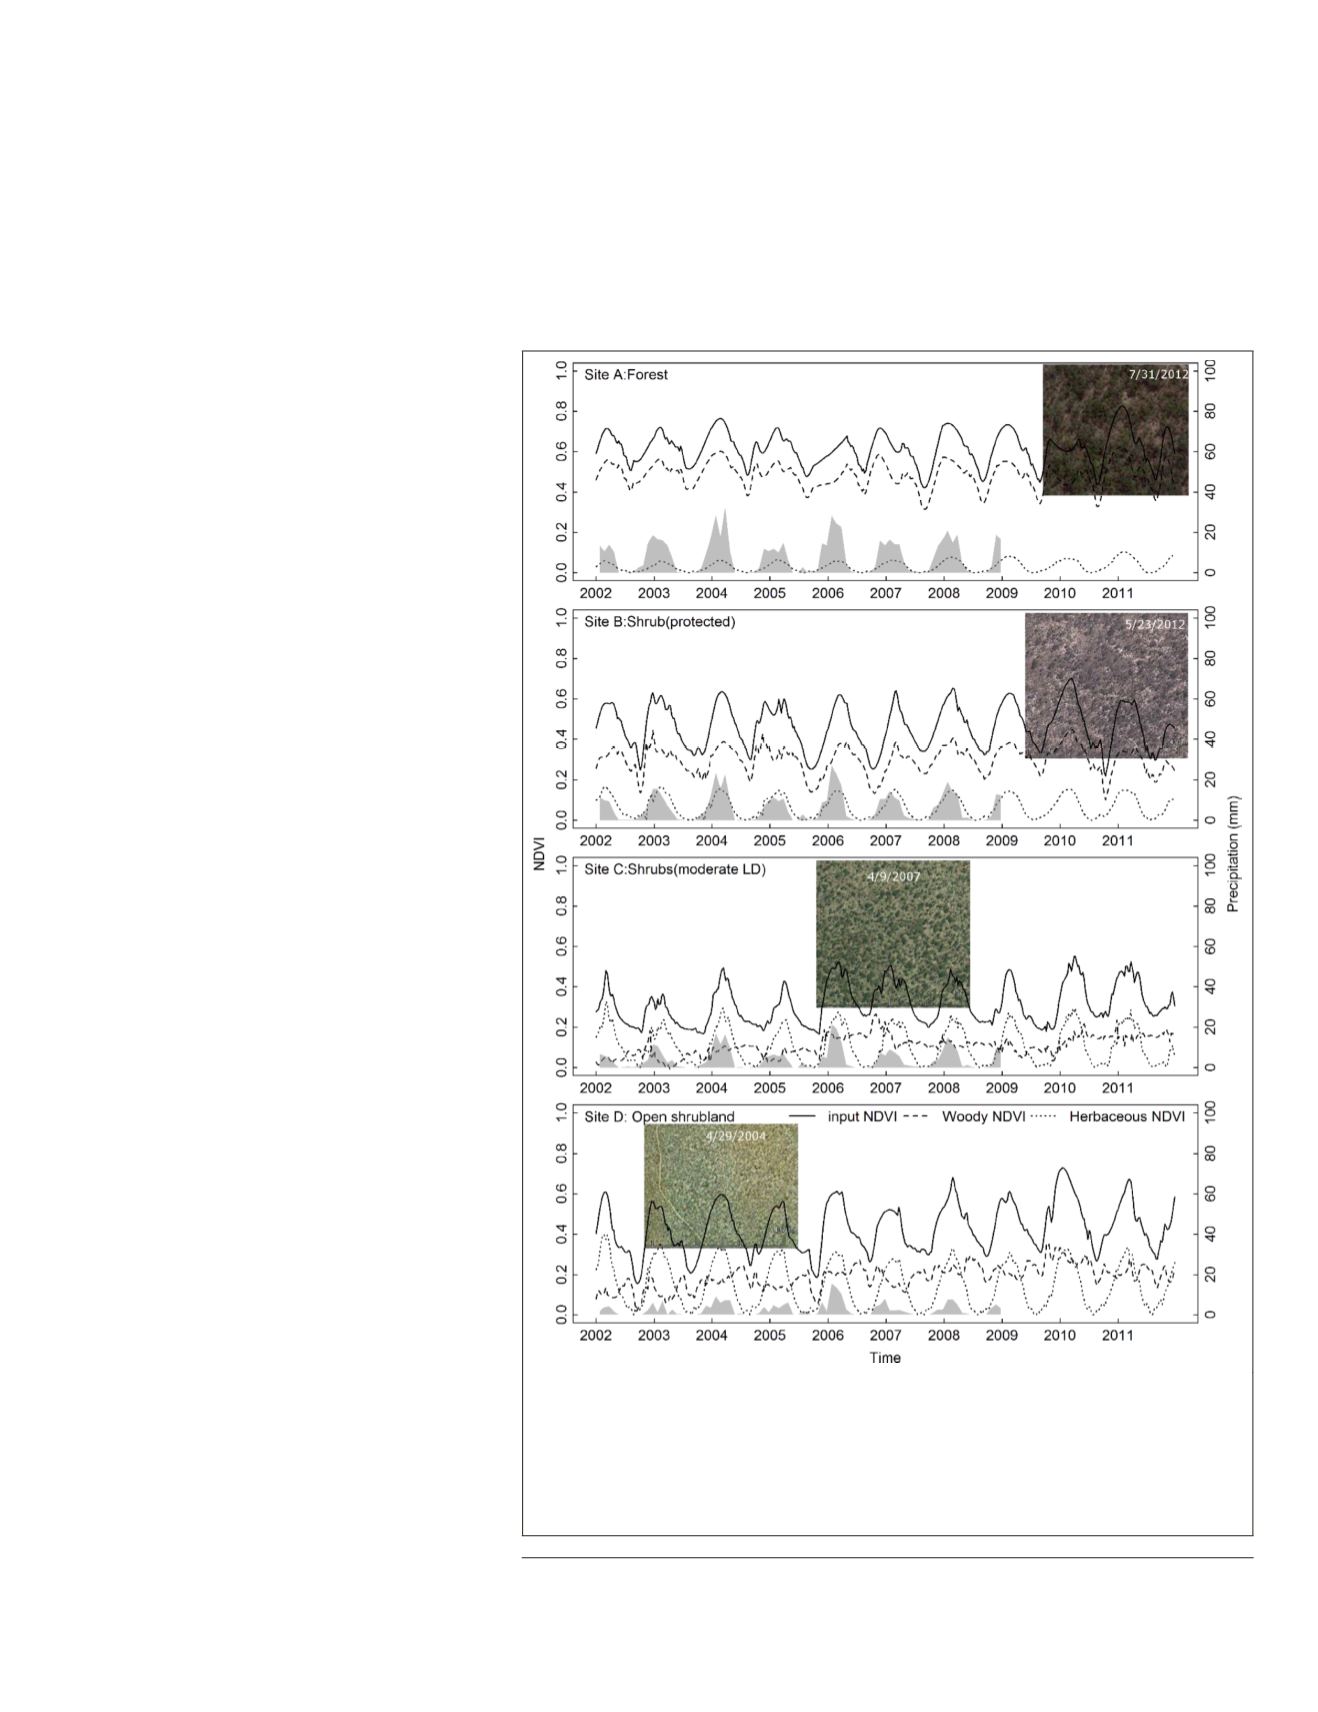
NDVI Decomposition at Four Representative Sites
Figure 7 shows the decomposition results at
four locations (Figure 1) representing four
typical land cover types from the Food and
Agriculture Organization (
FAO
) land use
characteristics. Site A (forest) had a total
NDVI
varying between 0.4 and 0.8. Most
of the
NDVI
came from woody component
while herbaceous
NDVI
was less than 0.1.
Site B (protected shrubland) had lower total
NDVI
with a faster decreasing rate in most
years than site A. Both woody and herba-
ceous vegetation was prevalent on this site,
and herbaceous
NDVI
achieved 0.17. Site C
(shrubland with moderate livestock den-
sity) had the lowest total
NDVI
of the four
sites and negligible woody vegetation. The
woody
NDVI
remained low except in 2006
and 2007, and reached its maximum at the
early growing season of 2007. Site D (open
shrubland) was mostly covered by grass
with sparse woody vegetation. Virtually all
of the seasonal signal at this site was pro-
vided by the herbaceous component. The
herbaceous
NDVI
achieved a maximum value
of 0.4 and dominated the total
NDVI
seasonal
variation. The decreasing fraction of woody
NDVI
and increasing fraction of herbaceous
NDVI
from Site A to Site D agreed with the
gradients shown in
FAO
land use (Figure
2a) and Ecoregion characteristics (Figure
1) from forest to shrubland and grassland.
Moreover, the woody time series exhibited
an earlier increase and later decrease in
NDVI
than the herbaceous time series at all
four sites.
Spatial and Temporal Variation of
Decomposed NDVI Signals
Figure 8 shows the monthly
NDVI
of the
woody and herbaceous vegetation aver-
aged for the period 2002–2011. Woody
NDVI
exhibits an overall gradient decreasing from north to south,
while herbaceous
NDVI
showed more heterogeneous distri-
bution. The northern ecoregions (i.e. ER1 and ER2) showed
high woody
NDVI
with strong seasonal variation (Figure 8)
because of the dominant presence of semideciduous Miombo
tree species which only drop leaves for a short period (Fuller
1999; Veenendaal
et al.
2008). However, a close-up examina-
tion of variation in the Angolan Miombo Woodlands (red box)
shows high herbaceous and low woody
NDVI
, corresponding
to agriculture and urban areas in the Google Earth image. The
Figure 7.
NDVI
and its decomposed woody and herbaceous components at
four sites representing different land cover types. “Forest” (-13.25°, 19.54°);
“Shrub (protected)” (-16.06°, 19.89°); “Shrub (moderate
LD
)” (-17.46°, 20.18°);
“Open shrubland” (-20.89°, 19.96°). The lines denote the noise-removed
NDVI
,
decomposed woody
NDVI
, and decomposed herbaceous
NDVI
. The background
images are from Google Earth Pro are © 2017 DigitalGlobe. The gray area
denotes monthly preicpitation (mm) from 2002 to 2008.
1
1. Joint Institute for the Study of the Atmosphere and Ocean.
washington.edu/data_sets/ud/
PHOTOGRAMMETRIC ENGINEERING & REMOTE SENSING
July 2019
515


