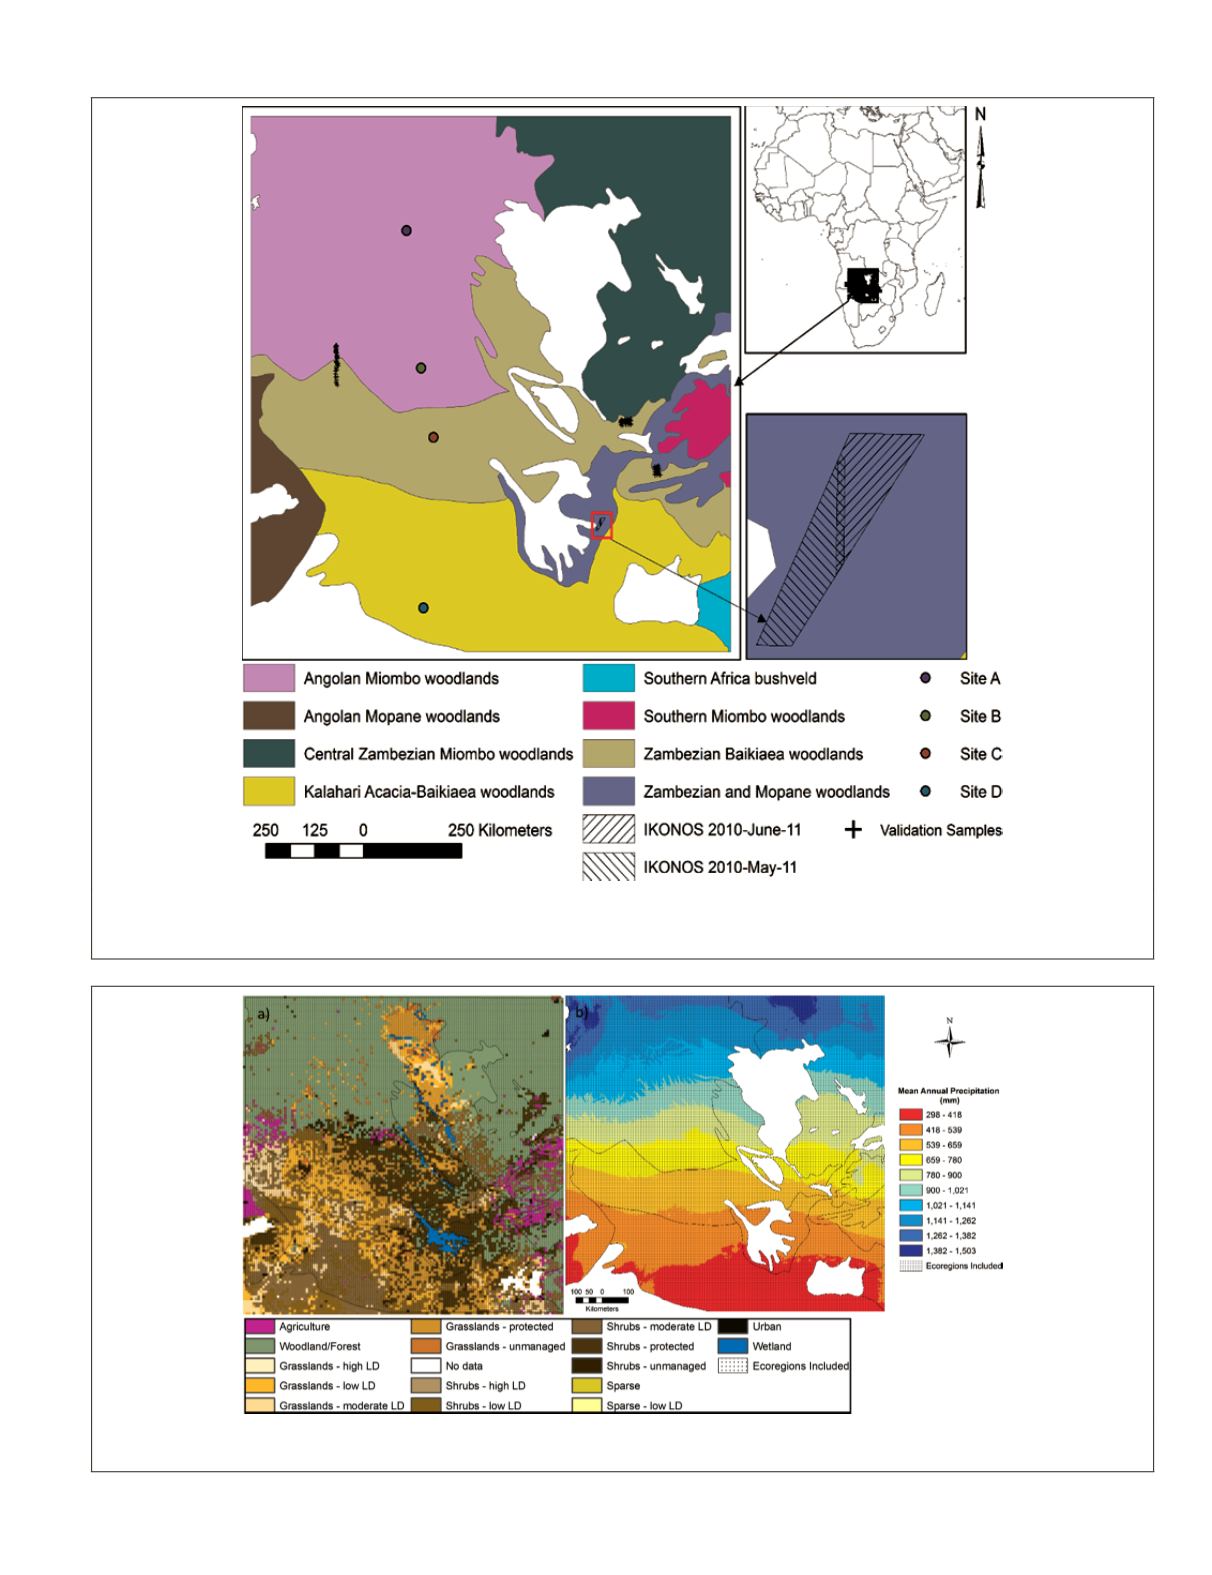
Figure 1. Southern African savanna ecosy
onsavanna (white) ecoregions are masked
out. The black crosses are validation sites
in panel shows the extents of two
IKONOS
images within the red box.
Figure 2. a)
FAO
Land Use characteristics including indications of livestock density (
LD
) (
FAO/ISRIC
2003); and b) Mean annual
precipitation (1950–2000) in the Africa savanna from Wor
ld
Clim—Global Climate Data (Hijmans
et al.
2005).
PHOTOGRAMMETRIC ENGINEERING & REMOTE SENSING
July 2019
511


