central ecoregions (i.e., ER4 and ER7 ecoregions) showed
the largest seasonal variations with woody
NDVI
reaching the
highest value in January and the lowest in August. Those
ecoregions also showed a transition from dominant woody to
herbaceous
NDVI
from north to south. The southern ecoregions
(i.e. ER3, ER5, and ER8) showed very low woody
NDVI
and
low temporal variation, related to low woody cover driven
by low precipitation. The ER8 showed decreasing herbaceous
NDVI
from north to south, and both woody and herbaceous
NDVI
were minor in the southern ER8. The maps showed very
low
NDVI
between July and September (Figure 8), associated
with senescence of the grasses, loss of leaves from tree spe-
cies, and general decline in vegetation cover as a result of
herbivory in the dry season.
Validation of Woody and Herbaceous Components
Figure 9a shows the time series endmembers used in the
simulation. Figure 9b and Figure 9c showed very strong linear
relationships between the decomposed and simulated compo-
nents (R
2
= 0.92 and 0.98, respectively). X
2
was the dominant
component in the mixed time series, and the estimated value
matched well with the simulated value with the regression
line overlapped with the 1-1 line. X
1
contributed less to the
mixed time series, and it was slightly underestimated based
on the regression line. It noteworthy that the noise (±0.1) in
X
1
is relatively more significant than the noise in X
2
based on
the magnitude of the endmember time series. This compari-
son indicates that the method performs robustly in separating
mixtures of distinct signals assuming these signals are repre-
sentative of the actual vegetation on the ground.
The results of the fractional cover-based comparison are
shown in Figures 6a and 6b). The herbaceous decomposed
NDVI
fractions showed a better correspondence with the cor-
responding image-based cover fraction than did the woody
decomposed
NDVI
fraction (R
2
= 0.55 for woody and R
2
= 0.64
for herbaceous). There was a wide range of woody cover at
high resolution for a given level of decomposed woody
NDVI
fraction. However, there was better correspondence between
the decomposed woody
NDVI
fraction and combined data from
Google Earth visual transects and data acquired in previously
published studies (Figure 10c).
Discussion
This paper demonstrated a new method and the framework to
separate the phenological dynamics of deciduous woody and
herbaceous vegetation using frequency information. Tradi-
tional methods assumed that the evergreen woody phenologi-
cal dynamics are negligible or the same (but small proportion)
as herbaceous vegetation, which were reasonable for savan-
nas with only evergreen woody (Lu
et al.
2003; Helman
et al.
2015). Comparing to traditional approaches, the approach has
several advantages. First, it captures seasonal differences of
deciduous woody and herbaceous vegetation and omits high
frequency variation due to discrete events such as precipita-
tion or disturbances (Figure 5). Second, it can fit not only the
amplitude but also the phases of seasonal variation, which
could reduce errors caused by the temporal shifts between the
pure woody/herbaceous vegetation and the mixed vegeta-
tion. These attributes are important for improved monitor-
ing temporal changes in savanna ecosystems and for further
understanding their impact on productivity, wildfire, and
biogeochemical cycles (Kahiu and Hanan 2018).
The approach is considered successful because of the con-
sistent relationship between the simulated and decomposed
components (Figure 9) and between the decomposed
NDVI
and
fractional cover data (Figures 6a and 6b). The relatively poor
correspondence between the decomposed woody
NDVI
and
woody cover fraction from the high resolution images may
be explained by specific heterogeneity in woody density and
distribution at these image limited locations interacting with
the 500 m pixel scale, since they could not be considered
representative of the wide array of vegetation across the study
region. The fractional cover data derived from high-resolution
imagery covered various vegetation species in both the dry
season and rainy season. The linear relationship between
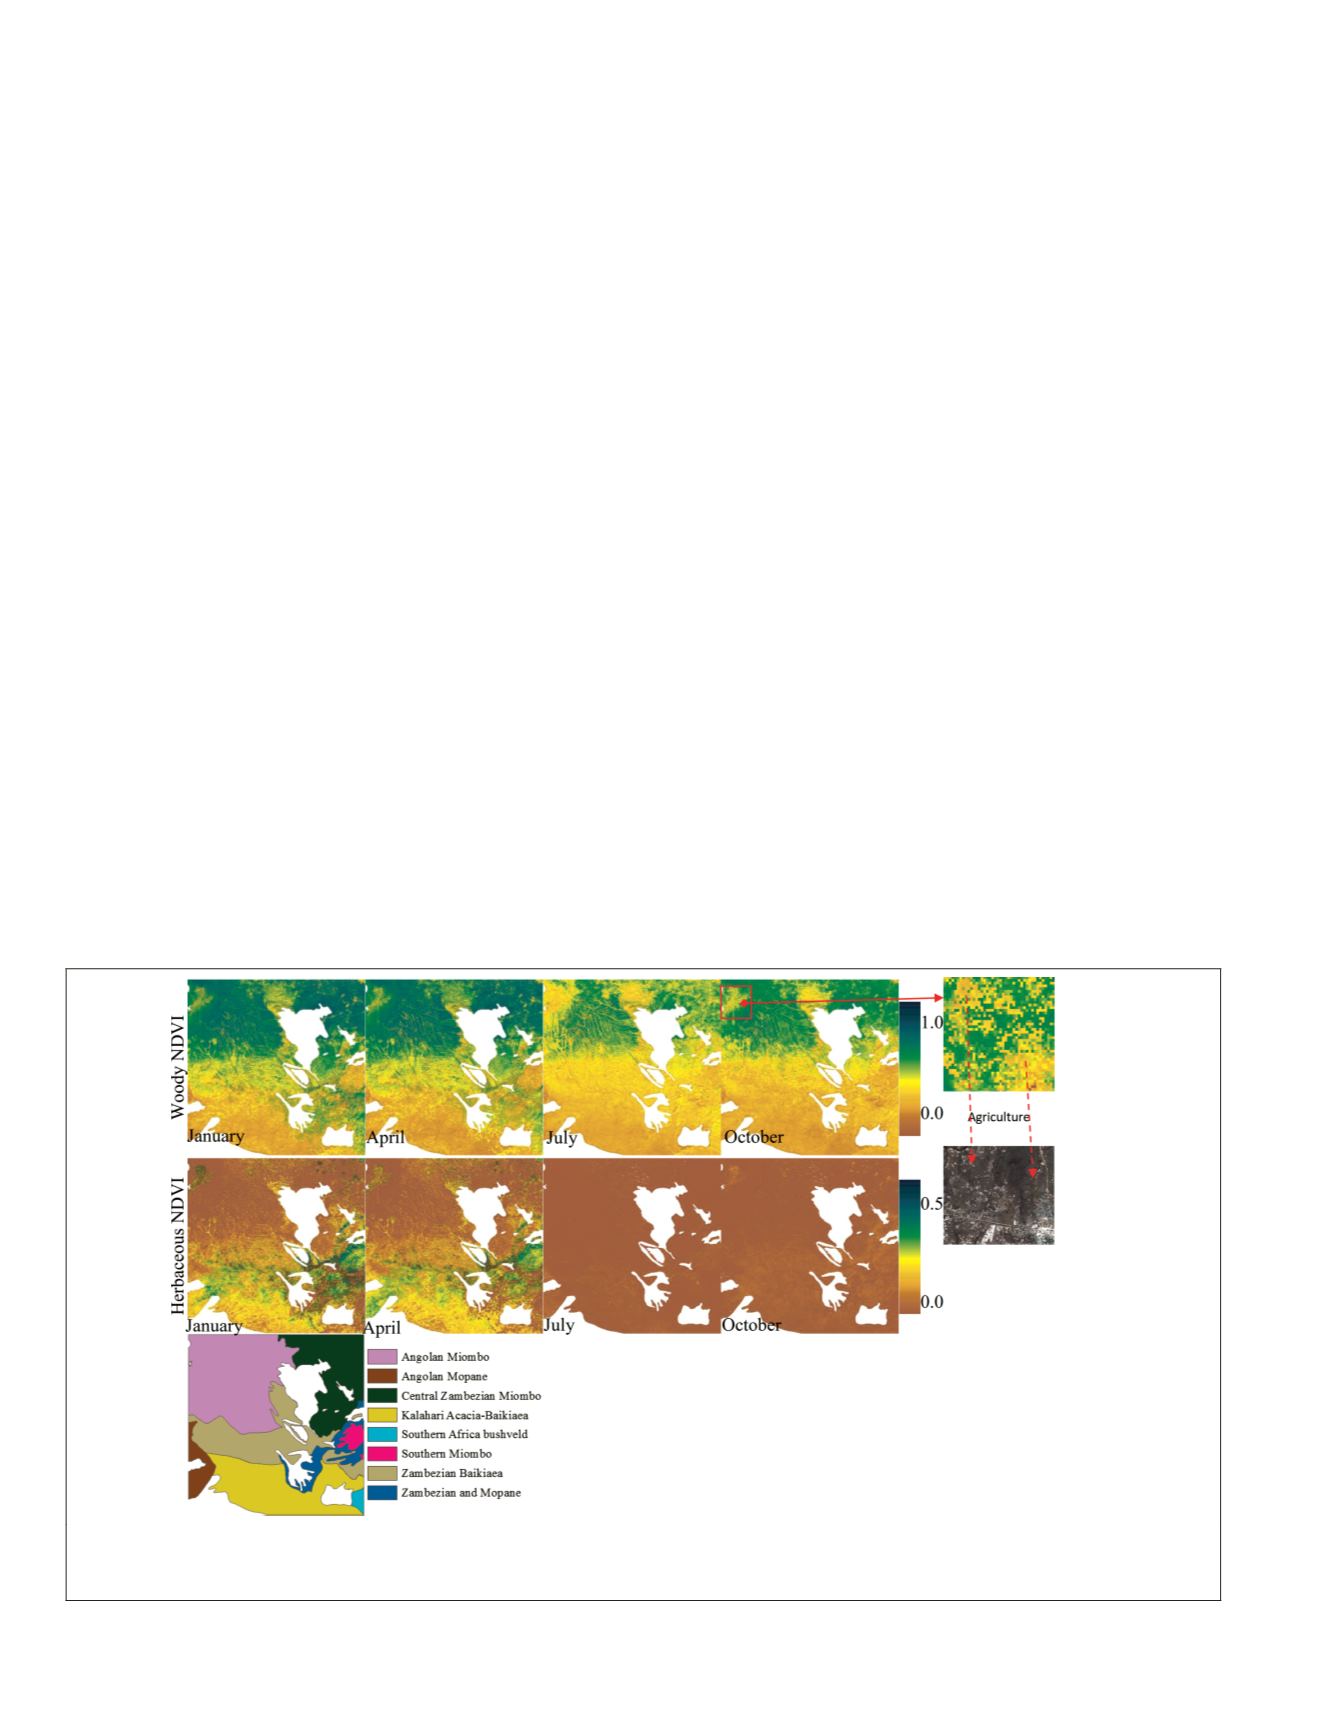
Figure 8. Estimates of monthly average woody and herbaceous
NDVI
(2002–2011). The color ramp from dark blue to orange
indicates the
NDVI
value from high to low. A zoom in area (red box) shows agriculture and urban cover based on the Google
Earth image. The bottom row exhibits the ecosystem boundary.
516
July 2019
PHOTOGRAMMETRIC ENGINEERING & REMOTE SENSING


