The frequency sequence of the mixed pixel
can be decomposed into frequency sequences of
endmembers (i.e., pure herbaceous and woody
vegetation; selection method is described the
section “Selection of Endmembers”) based on the
linearity of the Fourier transform:
F c V c V c F V c F V
1 1 2 2
1
1
2
2
+
(
)
=
( )
+
( )
(2)
1
and
V
2
represent the time series of two
mbers, function F represents the Fourier
rm, and
c
1
and
c
2
are complex numbers.
The phases of
c
1
and
c
2
represent the temporal
shift compared to the variables
V
1
and
V
2
, and the
amplitude of
c
1
and
c
2
shows the amount of
V
1
and
V
2
in the mixed pixel time series.
The frequency decomposition intends to sepa-
rate woody and herbaceous vegetation seasonal
variation. However, we assume that the
NDVI
time
series contains three types of variations. Type 1 is
the baseline variation from semideciduous woody
vegetation (typically when photosynthetically-
active herbaceous vegetation is absent during dry
seasons) and soil background information. Type 2
are the seasonal variations from both herbaceous
and woody vegetation that are related to climate.
Type 3 is the short-term variation from herbaceous
and woody vegetation caused by local environ-
ment and weather variations. The type 3 varia-
tion can introduce uncertainties to the frequency
decomposition, because the same woody and
herbaceous combination may have different local
environment and weather variations at various
regions. Therefore, only type 2 is used to decom-
pose the woody and herbaceous variation, while
types 1 and 3 are integrated into the time series
after the decomposition. Previous studies showed
that the
NDVI
variation mostly comes from green
woody and green herbaceous vegetation while the
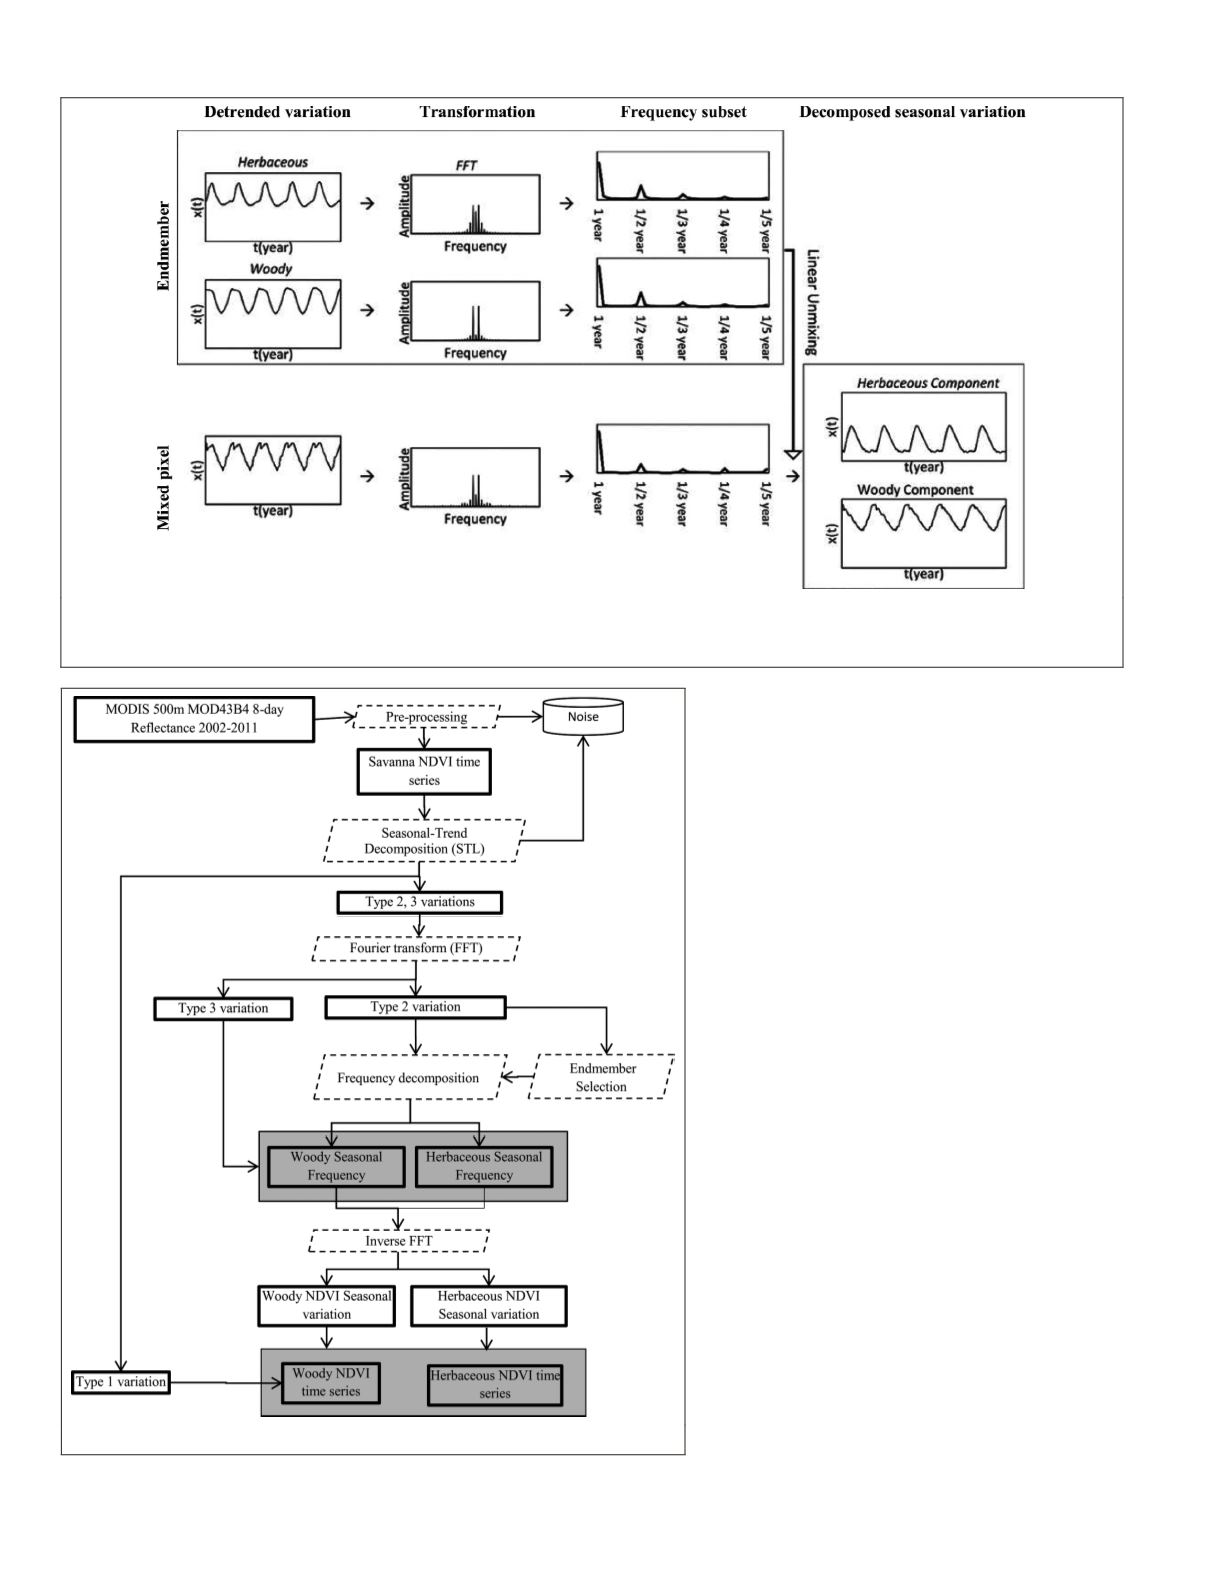
Figure 3. Schematic illustrating the approach for frequency decomposition. The detrended variation represents
NDVI
time
series with multi-year trend removed. After Fourier transform, a frequency subset is used to represent the seasonal variation.
The decomposed seasonal variation represents the estimated contribution of endmember components within the mixed pixel.
Figure 4. Workflow of frequency decomposition.
512
July 2019
PHOTOGRAMMETRIC ENGINEERING & REMOTE SENSING


