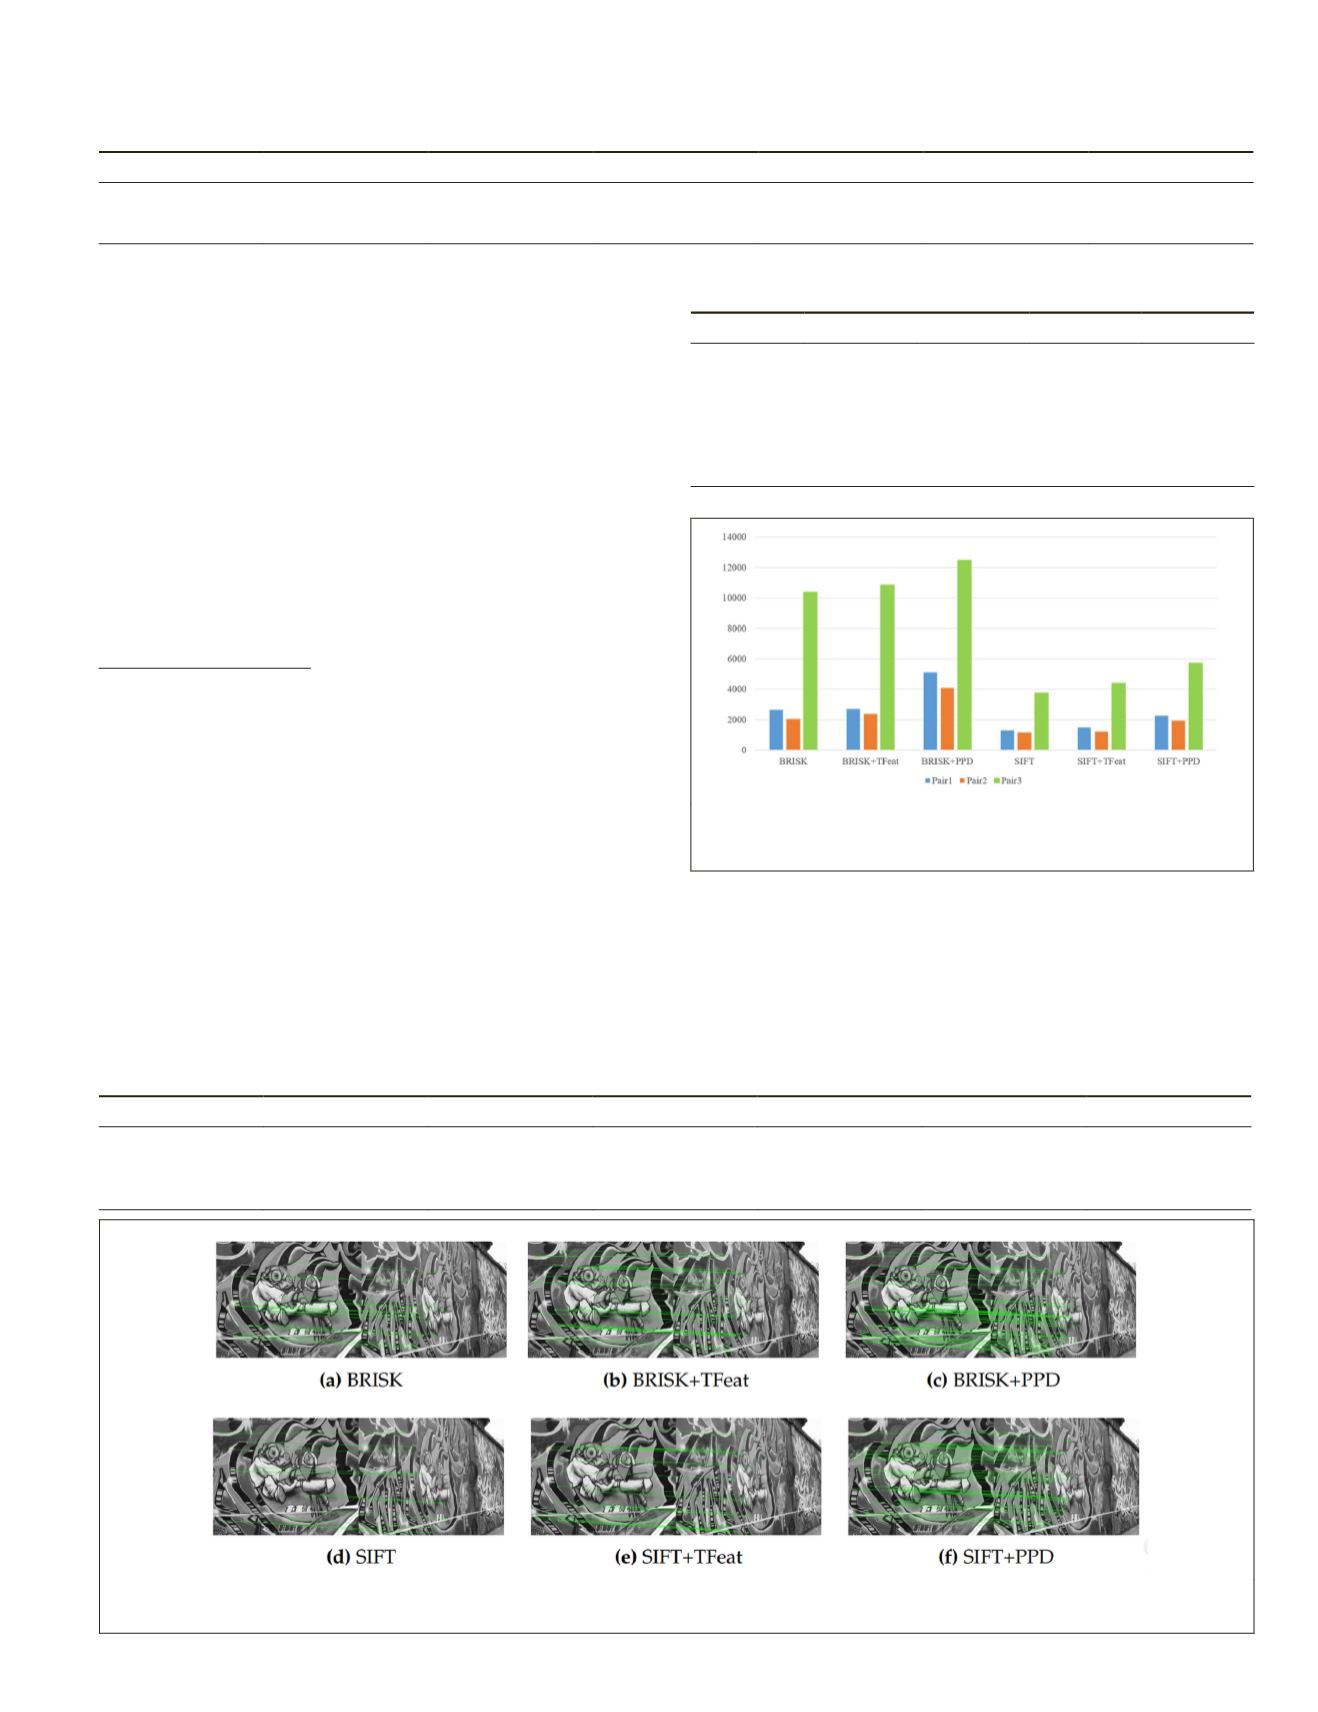
Especially, the correspondences extracted by the proposed
deep descriptor
PPD
are nearly three times those of the
SIFT
and
BRISK
descriptors. Figure 12 shows the correspondences
extracted using different combinations of detectors and
descriptors in
v_graffiti
. The correct matches are linked with
the green line. The combination of the
SIFT
detector and the
proposed
PPD
descriptor has the top performance in the image
pair
i_leuven
with illumination variation among all other
combinations. The handcrafted descriptor
BRISK
is appar-
ently better than the deep descriptors
PPD
and TFeat when the
interest points are detected using th
SIFT
detector was adopted to extract
proposed deep descriptor
PPD
is bet
and the deep descriptor TFeat. Figu
spondences extracted using differen
tors and descriptors in
i_leuven
.
Remote sensing images:
Satellite image with illumination
variation: Four satellite images acquired over the city of Paris,
France, on different dates ranging from October 21, 2007, to
February 26, 2019, downloaded from Google Earth are used
to show the effectiveness of the proposed descriptor under
illumination change. The satellite images with a resolution of
1644×944 pixels are group into three image pairs to show the
matches. Table 7 shows the basic information of the key points
using different feature detection algorithms, including
BRISK
and
SIFT
, in the three image pairs. Although all descriptors can
find enough matches in three multi-temporal image pairs, the
proposed
PPD
descriptor is always better than
SIFT
,
BRISK
, and
TFeat as seen in the number of correspondences in Table 8. Fig-
ures 14, 15, and 16 show the correspondences in three multi-
temporal image pairs using different combinations of hand-
crafted feature detection algorithms and learned descriptors.
Aerial image with viewpoint variation: Three oblique
image pairs acquired over the city of Zurich, Switzerland,
with a medium-format camera (Leica RCD 30 Oblique Penta)
are used to demonstrate the effectiveness of the proposed
descriptor under viewpoint variation. We resize the original
images, free of lens distortion, with 9000×6732 to 3000×2244
Table 6. The basic information of the patches in the two image data set. KeyPoint1-B and KeyPoint2-B are the numbers of interest
points extracted from an image pair using the BRISK algorithm, while KeyPoint1-S and KeyPoint2-S use the SIFT algorithm.
Data Set
Variation
Resolution
KeyPoints1-B KeyPoints2-B KeyPoints1-S
KeyPoints2-S
i_leuven
Illumination
921×614
719
2944
997
3297
v_graffiti
Viewpoint
800×640
3524
5204
2678
3922
Table 7. The basic information of the four different acquired
satellite images.
Image 1 Image 2 Image 3
Image 4
Acquisition
Date
21 October
2007
16 April
2014
18 May
2018
26 February
2019
Resolution 1644×944 1644×944 1644×944 1644×944
BRISK 88 721
68 565
46 804
72 398
SIFT
42 392
41 241
36 284
35 900
Figure 11. The number of correspondences after outlier
removal using
RANSAC
for different detectors and
descriptors in data sets
i_leuven
and
v_graffiti
.
Table 8. The number of correspondences of the three image pairs using different combinations of detector and descriptors. PPD
is the proposed learned deep descriptor. Bold numbers indicate that the corresponding descriptors have the top performance.
BRISK
BRISK+TFeat
BRISK+PPD
SIFT
SIFT+TFeat
SIFT+PPD
Image Pair1 (1–2)
399
194
810
418
209
539
Image Pair2 (1–3)
438
251
735
420
185
467
Image Pair3 (1–4)
305
111
437
239
102
263
Figure 12. Feature point matching results of image pair
v_graffiti
after outlier removal using
RANSAC
through different
combinations of different detectors and descriptors.
PHOTOGRAMMETRIC ENGINEERING & REMOTE SENSING
September 2019
681


