one-classification-per year method less appealing (Chen
et
al.
2003). Xian
et al.
(2009) developed a cost-effective change
detection method for updating
NLCD
every five years. Specifi-
cally, they first identified areas of land cover change between
2001 and 2006 using a change vector analysis. The change
pixels were subsequently classified into new land cover types.
Although this method is effective in updating national land
cover products at 5–10 year intervals, it is unclear whether it
is directly applicable for an annual mapping interval because
the associated change vector analysis may not be fully auto-
mated. In addition, the use of bitemporal change detection
focuses one image pair a time and does not make full use of
rich temporal information (Huang
et al.
2010).
An alternative approach for annual urban mapping is to
make full use of rich time series but coarser resolution remote
sensing data to conduct change detection. For example, using
high-temporal Moderate Resolution Imaging Spectroradi-
ometer (
MODIS
) data as input, Lunetta
et al.
(2006) examined
annual integrated Normalized Difference Vegetation Index
(
NDVI
) for each 250 m
MODIS
pixel to identify newly urban-
ized area. Change pixels were determined by applying
NDVI
change thresholds on a one-year time-step. Through this
approach, annual urban mapping is simplified as an annual
urban change detection problem. The main limitation of this
MODIS NDVI
-based annual change detection is associated with
MODIS
250 m coarse spatial resolution. Time series analysis
with 30 m Landsat data can be challenging because Landsat
satellite has lower temporal resolution (i.e., 16 days). The
U.S. Geological Survey’s (
USGS
) recent effort in analysis-ready
Landsat products significantly improved the potential of
Landsat-based time series analyses by standardizing data from
multiple Landsat satellites (
TM
,
ETM
, and
OLI
) (Banskota
et al.
2014). The dense Landsat time series stacks from multiple
Landsat satellites, combined with carefully designed analyti-
cal algorithms, are now increasingly used in characterizing
forest disturbance and land cover change at annual intervals
(e.g., Huang
et al.
2009; Huang
et al.
2010; Zhu
et al.
2012). Few
previously published studies, how-
ever, have examined automated
annual urban change mapping
using the relatively longer Landsat
time series data. It is also appeal-
ing to develop annual urban maps
that maintain an overall consis-
tency with the existing national/
regional land cover data, especially
when the existing national/regional
land cover products have accept-
able classification accuracies (e.g.,
NLCD
). Significant resources have
been used in generating national/
regional products and it is gener-
ally more cost-effective to update
the existing data than develop a
completely new urban map prod-
uct (Xian
et al.
2009).
The purpose of this study is to
evaluate annual urban mapping by
combined use of time series Land-
sat data and
NLCD
. Specifically,
we first used decadal
NLCD
data
to identify areas of urban change
from 2001–2011. Within the urban
change mask, we analyzed
NDVI
time series from Landsat data,
pixel-by-pixel, to identify year of
change. We compared three change
detection methods using Landsat-derived
NDVI
time series:
(a) minimum-value method, (b) break-point detection, and
(c) simple-threshold identification. We conducted detailed
accuracy assessments for our annual urban maps by visual
interpretation of Google Earth’s High-Resolution Imagery
Archive. In addition, we examined how map accuracies vary
when the length of input
NDVI
time series changes.
Methods
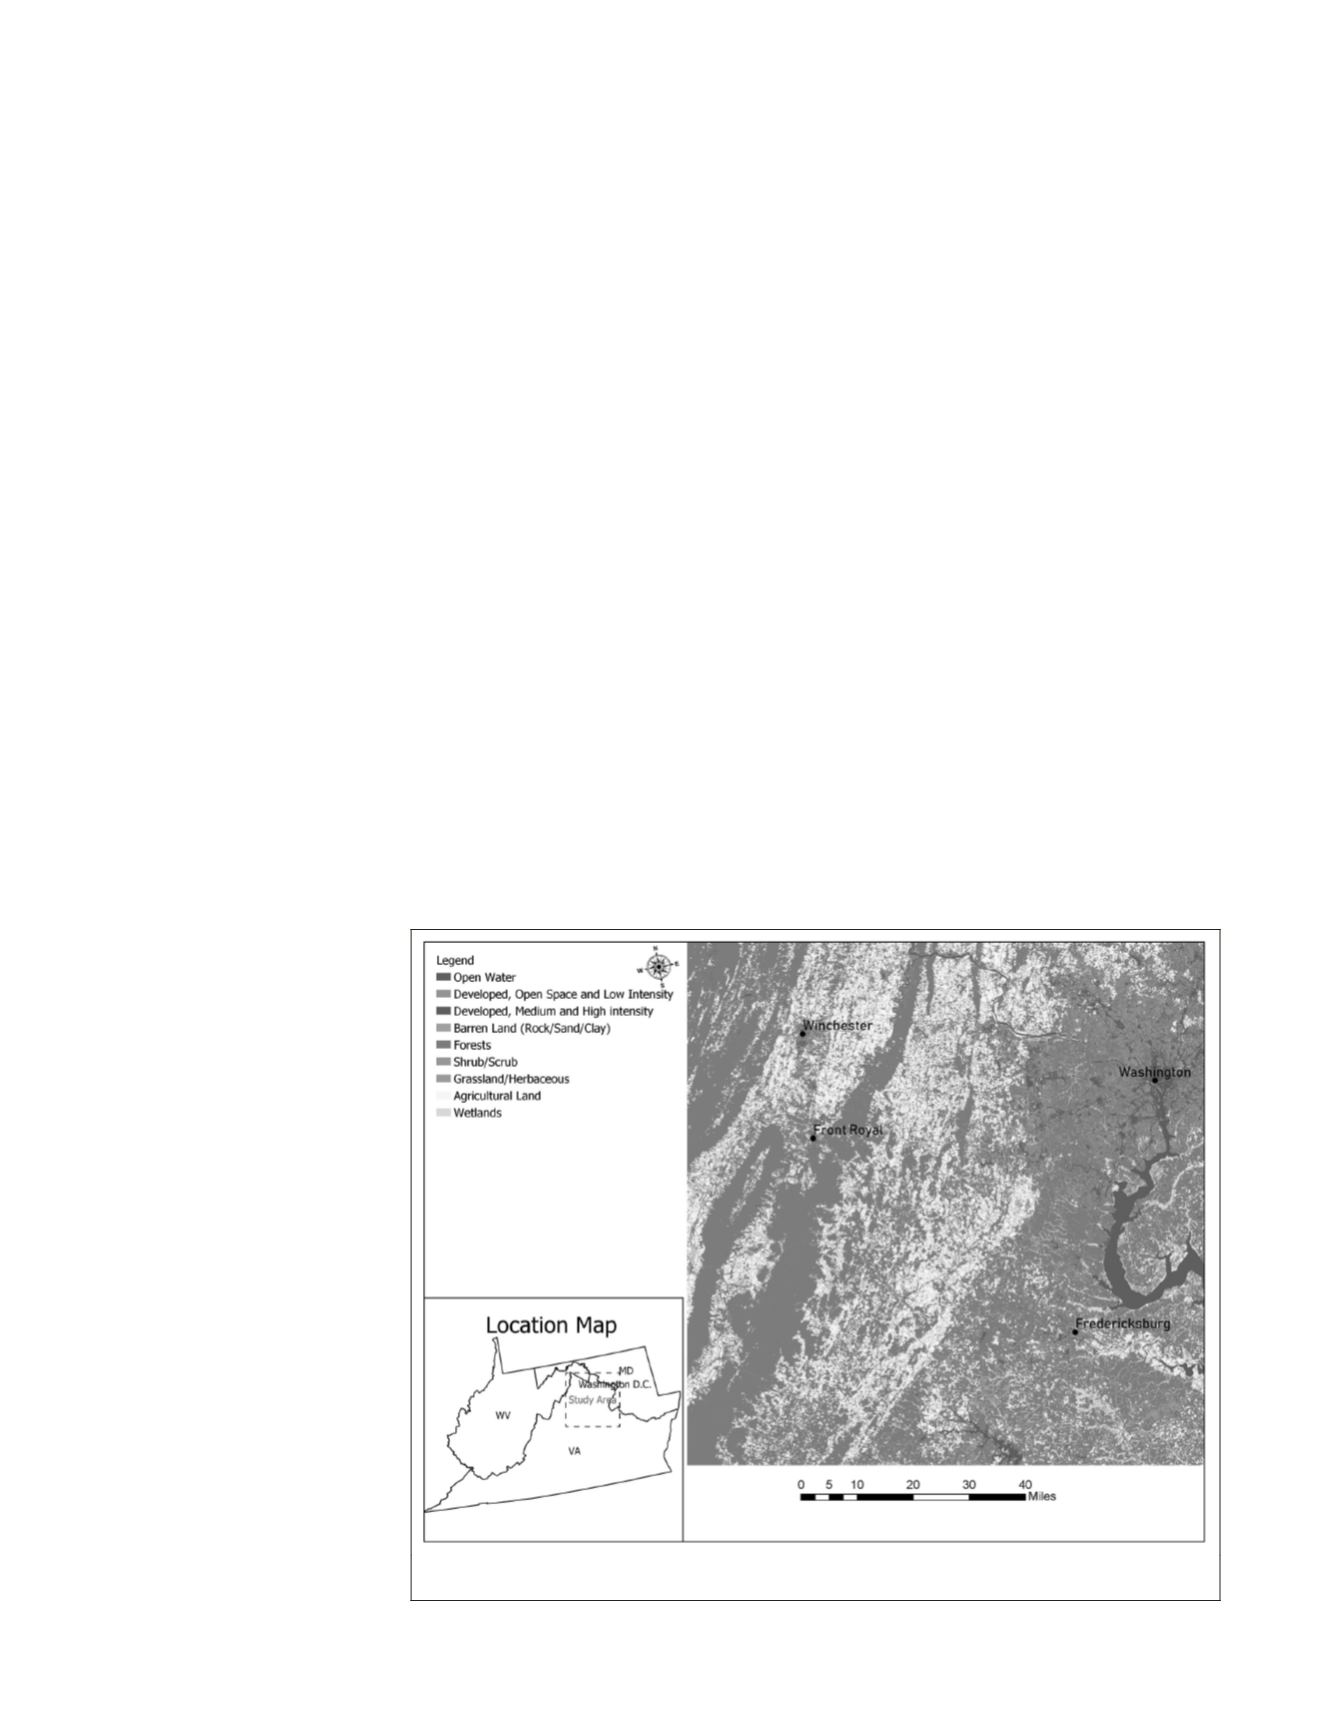
Study Area
The study area (22 500 km
2
) covers the northwest portion of
the Washington D.C. metropolitan area, northern Virginia, and
a small portion of West Virginia (Figure 1). The Washington
D.C. metropolitan area and its suburbs (northern Virginia) are
among the fastest growing regions in the U.S., with an average
urbanization rate of 11±2 km
2
/year (Sexton
et al.
2013). An-
other reason for choosing this study area is due to its diversity
in land cover types, including 2.83% of water body, 16.88%
of urban and barren land, 49.05% of forest, 2.45% of shrub
and grassland, 25.29% of agriculture, and 3.48% of wetlands
in 2001, based on 2001
NLCD
data. The robustness of annual
urban mapping technique can be tested on varied land cover
types. Finally, this study area has a good collection of high
spatial resolution images based on Google Earth’s High-Reso-
lution Imagery Archive, thereby providing easier implementa-
tion of accuracy assessment at higher temporal resolution.
Data
A total of 1292 Landsat Analysis Ready Data (
ARD
) (h027v009,
ARD
tile) surface reflectance images from 1988 to 2017 were
downloaded from the
USGS
EarthExplorer
-
er.usgs.gov). Each image contains 5000 × 5000, 30-meter pix-
els. We included imagery with substantial cloud/shadow cover
as well as Landsat
ETM
+ scan-line corrector (
SLC
)-off imagery
in our original time series dataset, since for a given image
Figure 1. Study area covers the northwest portion of the Washington D.C. metropolitan
area, northern Virginia, and a small portion of West Virginia.
716
October 2019
PHOTOGRAMMETRIC ENGINEERING & REMOTE SENSING


