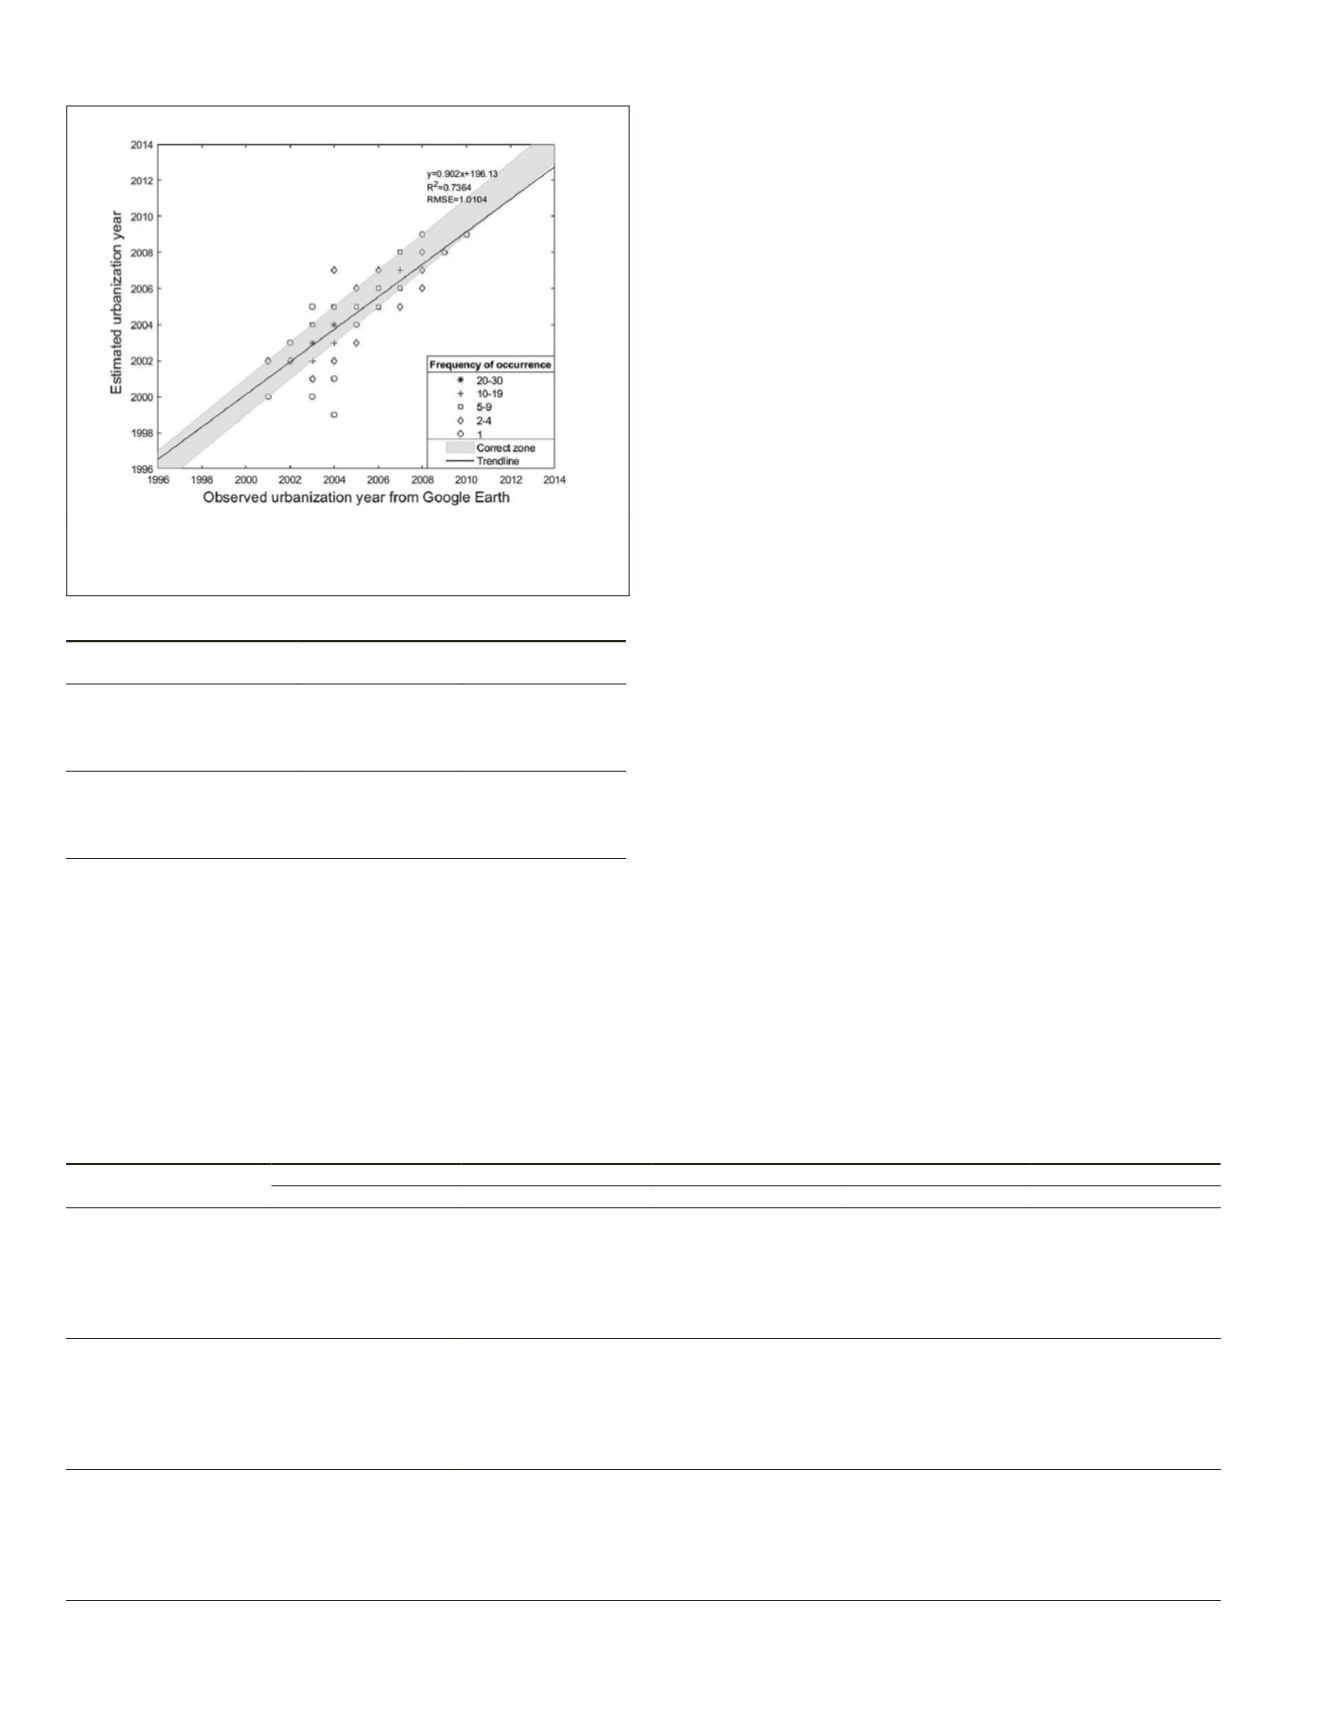
colors representing different frequencies of occurrence in the
accuracy assessment. One-year deviation from the observed
urbanization year from Google Earth is colored in yellow. It
appears that a large majority of points (90.6%) lie within the
one-year deviation zone, indicating good overall accuracy (R
2
is
0.74 and root mean square error (RMSE) value is 1.01 year).
Based on one-year deviation definition,
classification of change and no-change pix
grouped into two categories of correct or
and overall accuracy can be calculated for
Table 2 summarizes overall accuracies for three change
detection algorithms. Using 1998–2014 time series data as
input, the break-point algorithm generated the highest overall
accuracy of 88% for the one-year deviation accuracy assess-
ment. The minimum-value and simple-threshold (threshold
= 0.6) algorithms had the same accuracy of 82.5%. For the
simple-threshold algorithm, variation of threshold value to
0.5 and 0.7 led to reduced overall accuracy to 53.5% and
65%, respectively. Differences among three change detection
algorithms declined when the tolerance level increased to two
years of deviation. All three algorithms generated above 90%
of overall accuracy; the break-point algorithm had the highest
overall accuracy of 94%.
The accuracy of change detection generally decreased
when the longer time series (1988–2017) were used as input,
except for the minimum-value algorithm in the one-year-
deviation assessment. For example, the overall accuracy for
break-point algorithm decreased to 83.5% compared to 88%
resulted from 1998–2014 change detection. Longer time series
data may be associated with more complicated
NDVI
trends
involving longer-term
NDVI
increase/decrease patterns. Our
selected change detection algorithms thus can falsely identify
change years located beyond the 2001–2011 time period.
Accuracy Assessment for Urban-Intensification Pixels
The classification accuracy of
NLCD
for urban-intensification
pixels was much lower than that for urbanization pixels
(Table 3). Among 200 randomly selected change pixels, only
168 pixels (84%) appeared to be actual change pixels based
on Google Earth imagery and the remaining 32 pixels (16%)
should be labeled as no-change pixels. Among three change
detection algorithms, the break-point method achieved the
highest overall accuracy of 86.5% (kappa = 0.49) while
simple-threshold method performed worst with an overall
accuracy of 63.0% (kappa = 0.25).
Figure 5 shows scatter plots comparing the results from the
break-point algorithm (best performing one) and the visual
interpretation of Google Earth imagery. A total of 45 pixels
out of 200 were identified as no-change pixels either from
Google Earth or from the algorithm, so were not displayed on
the scatter plot. Compared to the urbanization pixel group,
the distribution of the scatterplot for urban intensification
is more scattered. A much smaller portion of the points lies
(76.6%), and there are more outli-
from the correct zone, indicating an
ban change year when compared with
urbanization pixel group. The R
2
(0.54) is much lower than
Table 3. Error matrices of change and no-change for urban-intensification pixels for time series 1998–2014.
Parameter
Google Earth Reference
No-Change
Change
Total
%Correct
%Commission
Minimum-value method
No change
7
5
12
58
42
Change
25
163
188
87
13
Total
32
168
200
85
(n = 200)
%Correct
22
97
%Omission
78
3
kappa = 0.25
Break-point method
No change
18
13
31
58
42
Change
14
155
169
91.7
8.3
Total
32
168
200
86.5
(n = 200)
%Correct
56.3
92.3
%Omission
43.7
7.7
kappa = 0.49
Simple-threshold identification
No change
28
70
98
28.6
71.4
Change
4
98
102
96.1
3.9
Total
32
168
200
63
(n = 200)
%Correct
87.5
58.3
%Omission
12.5
41.7
kappa = 0.25
Figure 4. Scatter plot of observed urbanization year versus
estimated urbanization year for break-point method using
MVC NDVI
time series 1998 to 2014.
Table 2. The overall accuracies for urbanization pixel group.
Time series
1998–2014, %
Time series
1988–2017, %
±1 year:
minimum-value
82.5
85.0
break-point
88.0
83.5
simple-threshold (t = 0.6)
82.5
82.0
±2 year:
minimum-value
92.0
88.5
break-point
94.0
91.5
simple-threshold (t = 0.6)
90.0
89.0
720
October 2019
PHOTOGRAMMETRIC ENGINEERING & REMOTE SENSING


