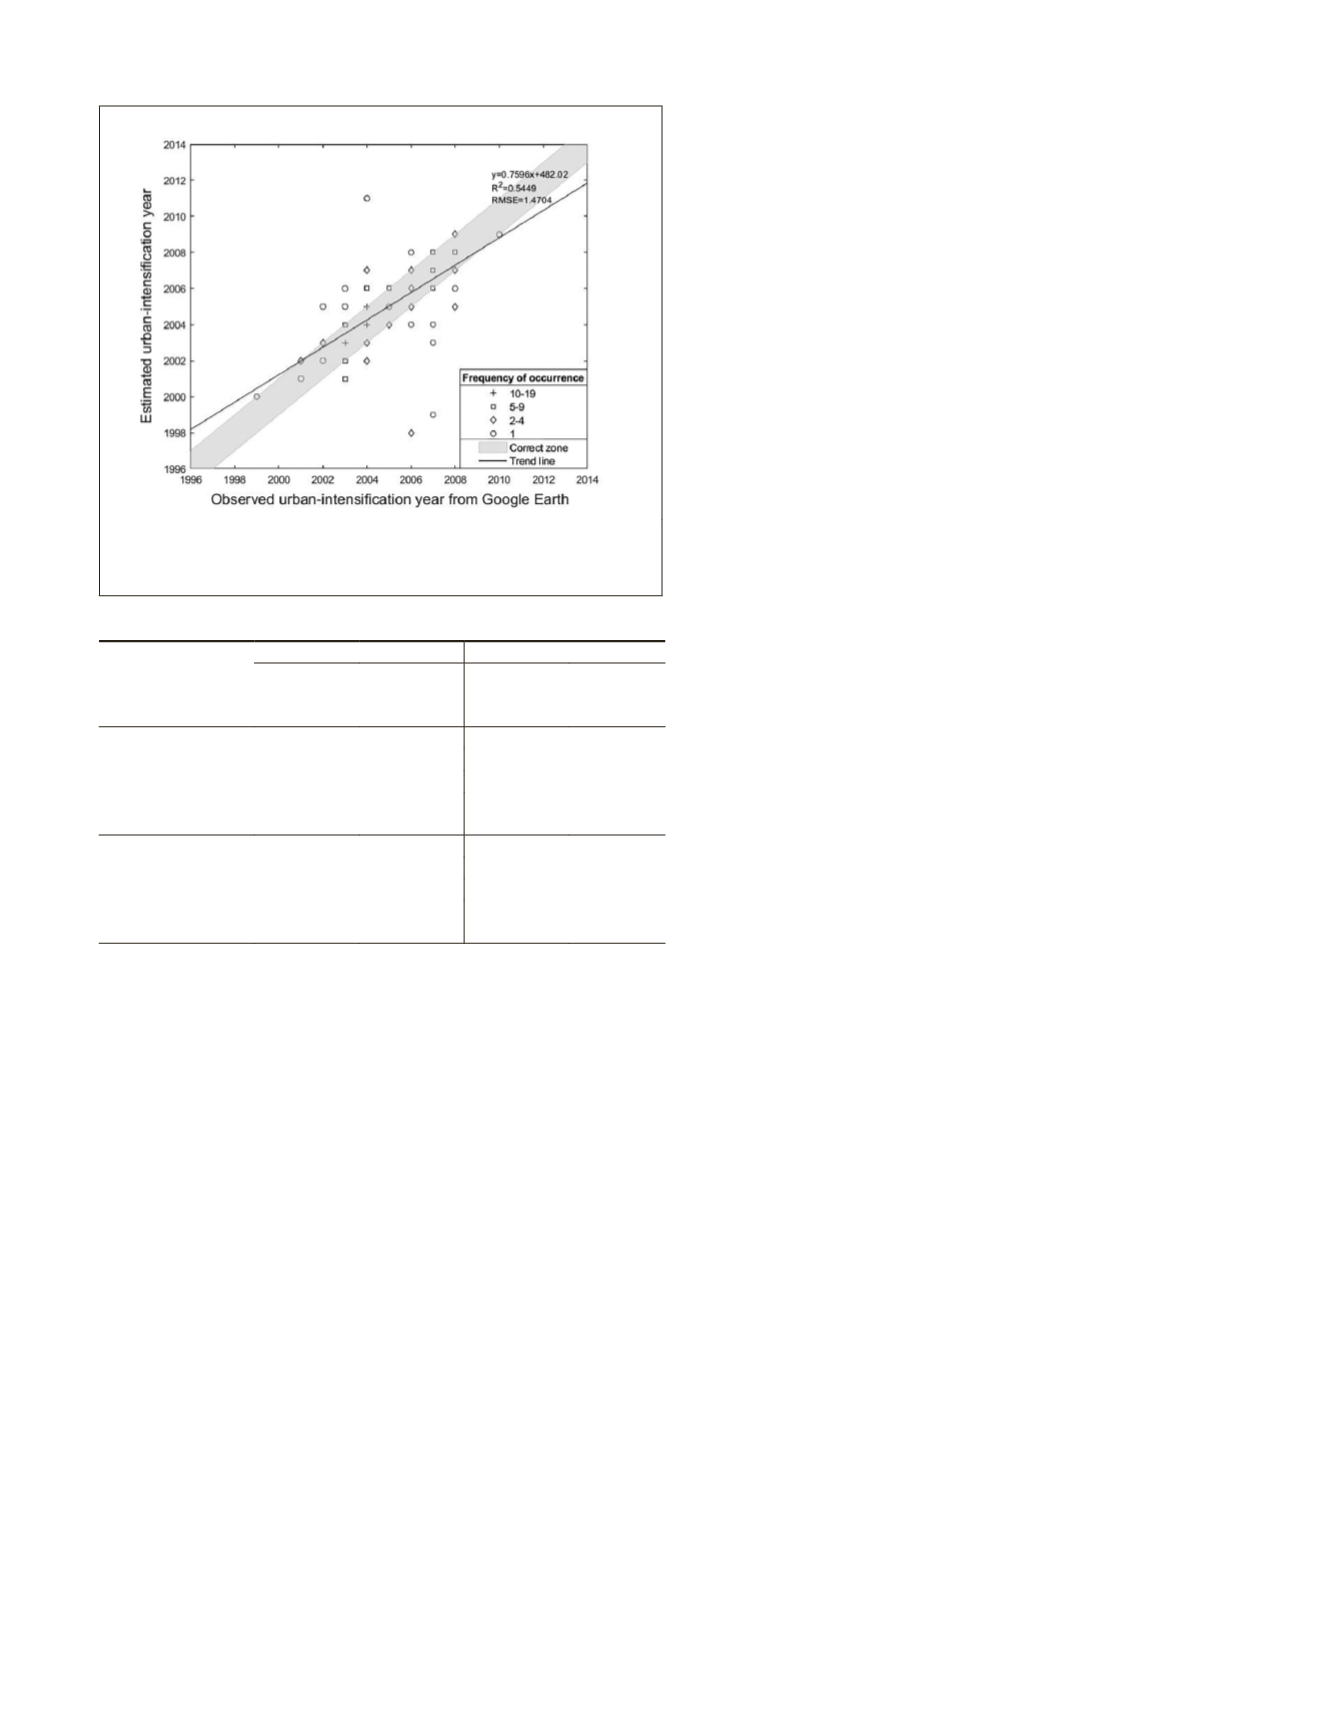
that of urbanization pixel group while the RMSE (1.47 year)
here is higher.
Overall accuracies of urban intensif
change detection methods are shown i
urban intensification group, we further
pixels into two subgroups depending o
cover types: subgroup 21 represents change pixels with initial
land cover class of open space (
NLCD
class 21) and subgroup
22 represents change pixels with initial land cover class of
low intensity urban (
NLCD
class 22). Using 1998–2014 time
series data as input and one-year-deviation accuracy as-
sessment, the break-point algorithm resulted in the highest
overall accuracy of 76% for subgroup 21 change detection.
The other two algorithms generated relatively lower accura-
cies of 59% and 65%, respectively. For subgroup 22, the
minimum-value algorithm performed best (65%), although
break-point algorithm’s performance was only 4% lower. The
simple-threshold identification (threshold = 0.6) performed
worst on subgroup 22 change detection. The overall accuracy
of 35% for subgroup 22 using simple-threshold identification
was substantially lower than accuracy statistics derived from
other algorithms. We did additional sensitivity analyses by
varying threshold values from 0.5 to 0.7, the best overall ac-
curacy achieved was only around 55%. This result suggested
poor overall performance of this change detection algorithm.
Comparing overall accuracies for two subgroups suggests
that the subgroup 22 is more challenging for annual change
detection. This was expected because the initial land cover
type for subgroup 22 is low intensity developed urban which
has about 40–49% of impervious cover within each 30 m
Landsat pixel. Although all pixels within the subgroup 22
experienced urban intensification during the 2001–2011 time
period, it was difficult to pinpoint the specific year of intensi-
fication through time series
NDVI
analysis.
For both subgroup 21 and subgroup 22, overall accuracies
generally increased when the length of the time series was ex-
panded to 1988–2017, with the exception of break-point algo-
rithm for subgropu21 change detection. This was the opposite
of the result observed for urbanization pixels (i.e., nonurban
to
NLCD
23/24). This may be explained by the fact that certain
algorithms’ ability to distinguish between no-change pixels
from change pixels had a much higher weight on the over-
all accuracy calculation. A significant portion (16%) of 200
randomly selected pixels were actual no-change pixels (i.e.,
falsely identified by
NLCD
). When using time series 1998 to
2014 as data input, the minimum-value method would falsely
assign an urban change year to a no-change pixel. By using a
much longer time series as input data, more pixels would be
assigned an urban change year outside the study time period,
thus potentially increasing overall accuracy. A longer time
series did not improve the performance of the break-point
method, because the break-point method detects the point
where means of the time series changes the most, and is less
sensitive to length of the time series when compared with
other methods.
Urban Change Maps
Urban change years for both urbanized pixels and urban-
intensification pixels obtained from the optimal method
(break point) are shown in Figure 6. In this figure, we grouped
pixels with similar urban change years and assigned different
colors to each group. To illustrate effects more clearly, Figure
6 shows only a subset of the study area. As we have expected,
pixels with the same or closer urban change years tend to
be clustered together on the map. A part of the Washington
Dulles Airport development can be seen as the L-shaped
structure in the center of figure. All the pixels for this airport
have similar urban change years from 2005 to 2008. Figure 7
summarizes total numbers of urban change pixels by year. It is
change rate increased from 1998 to 2003
reased year by year. Overall, a majority of
in our study area occurred between 2002
Novelty and Limitation
In our time series analysis, an
MVC
algorithm was applied
to the Landsat
NDVI
time series to develop the annual
MVC
NDVI
time series. The use of annual
MVC NDVI
time series has
greatly reduced data volume, and at the same time, removed
most of the noise in the original
NDVI
time series. For our ac-
curacy assessment, we divided change pixels into two groups,
urbanization and urban intensification. Separation of the
accuracy assessment could provide more detailed information
on the performance of our change detection algorithms.
Among three selected change detection algorithms, the
break-point algorithm can be considered as optimal, based on
two main reasons. First, the break-point algorithm is fully au-
tomated without user intervention while the simple-threshold
identification and minimum-value algorithm both need differ-
ent levels of calibration or threshold tuning.
A fully automated method is much preferred when it is
applied for a different study region or time-period. Second,
the break-point algorithm finds the point at which the mean
of the
NDVI
time-series changes the most significantly, thus it
is less sensitive to data noise, contributing to higher overall
detection accuracies.
Figure 5. Scatterplot of observed urban intensification year
versus estimated urban intensification year for break-point
method using
MVC NDVI
time series 1998 to 2014.
Table 4. Overall accuracies for urban intensification pixel group.
Subgroup 21, %
Subgroup 22, %
Time
Series
1998–2014
Time
Series
1988–2017
Time
Series
1998–2014
Time
Series
1988–2017
±1 year:
minimum-value 59.0
59.0
65.0
66.0
break-point
76.0
71.0
61.0
64.0
simple-threshold
(t = 0.6)
65.0
73.0
35.0
38.0
±2 year:
minimum-value 84.0
85.0
75.0
77.0
break-point
88.0
83.0
68.0
71.0
simple-threshold
(t = 0.6)
71.0
78.0
38.0
42.0
PHOTOGRAMMETRIC ENGINEERING & REMOTE SENSING
October 2019
721


