pixel is converted to a medium-high intensity urban pixel. Sim-
ilarly,
NDVI
values typically decrease, probably with a smaller
amplitude, when an open space/low intensity urban pixel is
further intensified to medium-high intensity urban.
We used 40 randomly selected urban change pixels (i.e.,
training data points) to conduct an initial assessment of this
minimum-value method, using Google Earth’s High-Resolu-
tion Imagery Archive as reference. It should be noted that ur-
ban change could be a multiyear process from the beginning
of clear-cutting to the completion of construction. We used
the beginning of clear-cutting as “ground truth” for urban
change. We found that there was typically a three-year time
lag between the minimum-value year and the observed urban
change year from Google Earth. In other words,
NDVI
values
may continue to decrease from beginning of clear-cutting and
reach its lowest value in the next 2–3 years, depending on
duration of construction activities. Therefore, we simply ap-
plied the three-year adjustment to correct the time lag for the
minimum-value method.
Break-Point Method
For each
MVC NDVI
time series, the specific urban change year
could serve as a break point dividing the whole time series
into two segments. This break point should maximize the
difference between the mean values of the two segments. To
be specific, the identified urban change year should result in
a maximum value of µ
1
- µ
2
, where µ
1
is the mean of the time
series segment ranging from starting year to the year of urban
change and µ
2
is the mean of the time series segment ranging
from the urban change year to the ending year of time series.
Simple-Threshold Identification
Another approach to identify a specific change year in a time
series
NDVI
is to specify a threshold value. Scanning the an-
nual
MVC NDVI
from the beginning of the time series, the year
where
NDVI
value first dropped below the threshold value can
be defined as the urban change year.
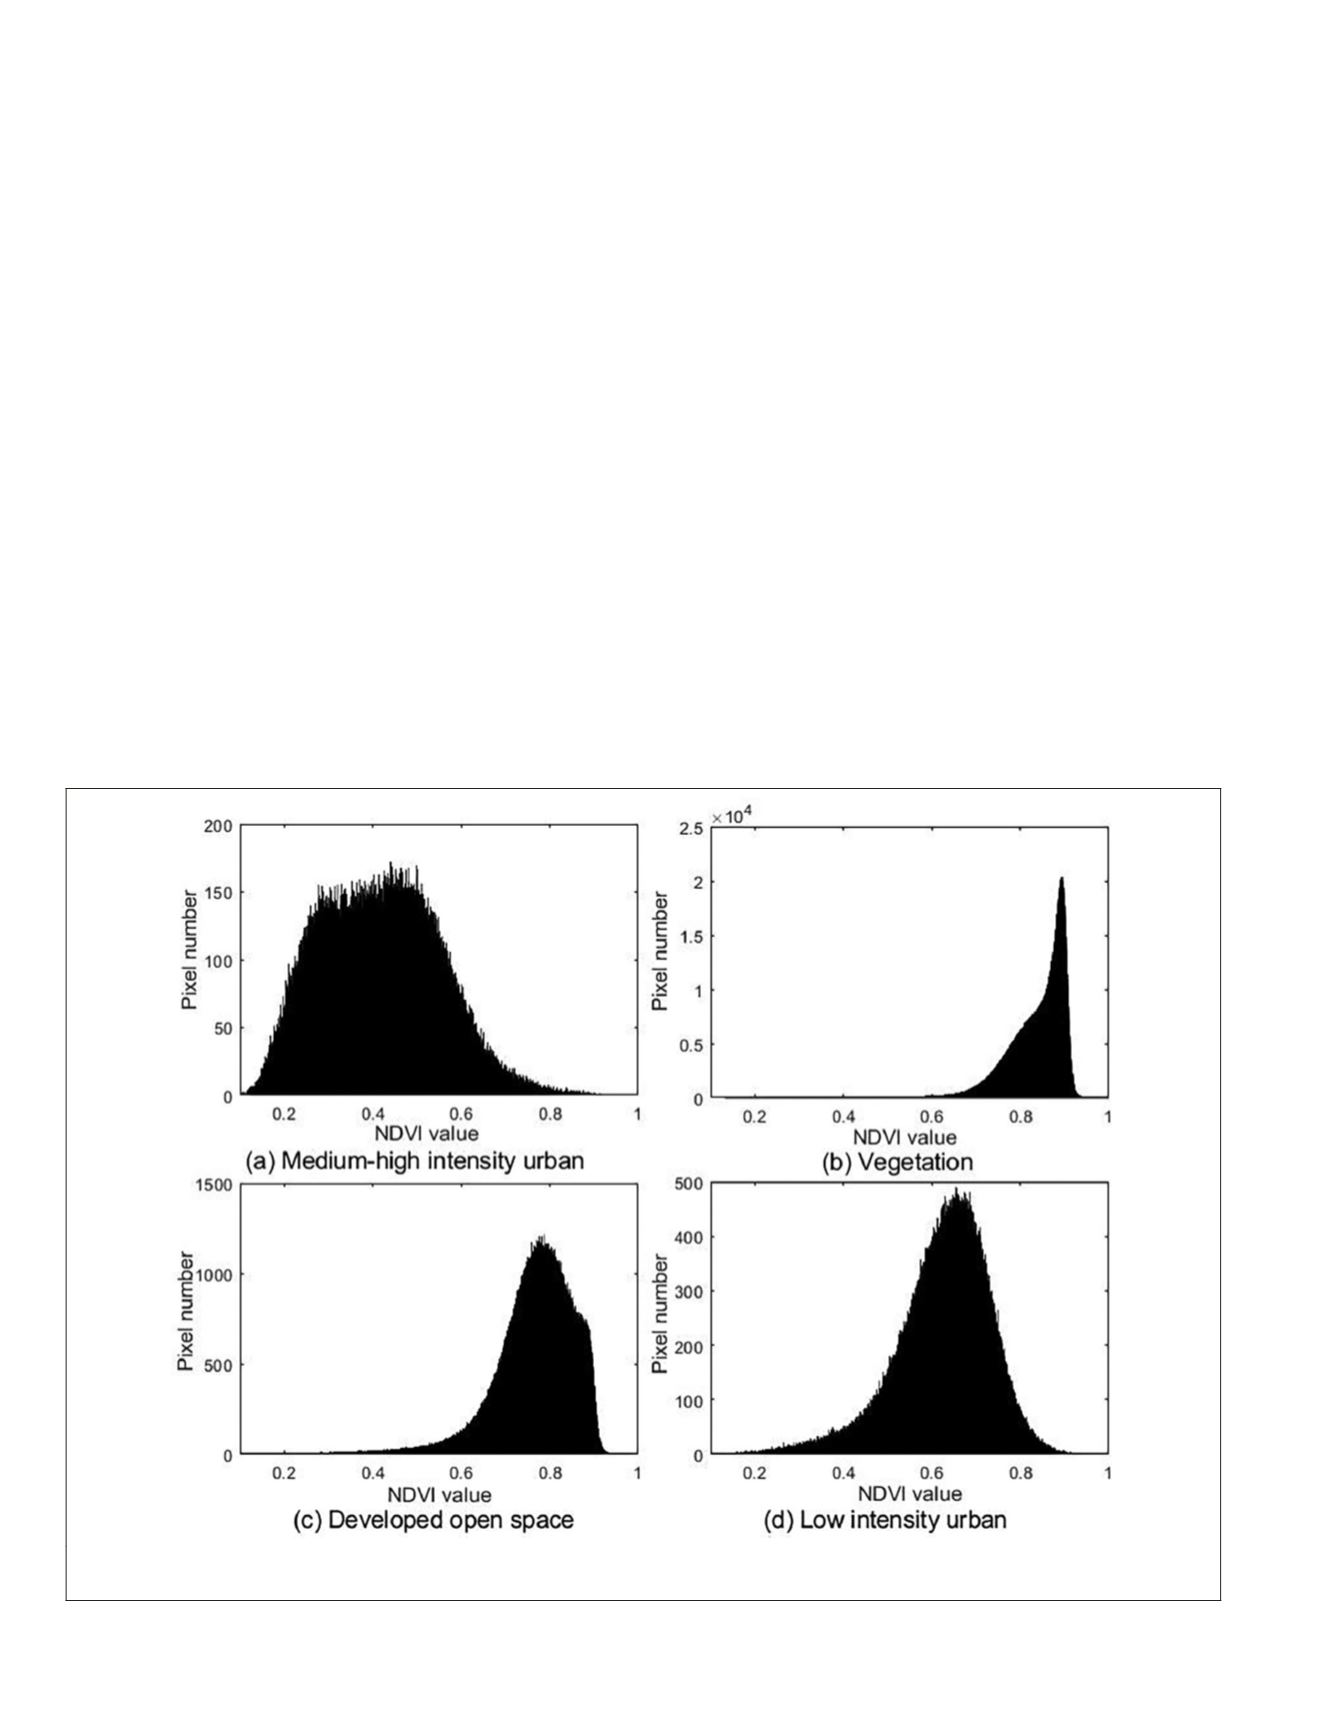
We evaluated potential threshold values by examining
the histogram plots of
MVC NDVI
values for various
NLCD
2001
land cover categories. Figure 3a shows the distribution of
MVC
NDVI
(2001) values for medium-high intensity urban pixels. A
large proportion of medium-high intensity urban pixels have
relatively low
MVC NDVI
values (e.g., 0.1–0.7). Conversely, the
vegetation pixels (e.g., forest and agricultural lands) and open
space pixels typically have high
MVC NDVI
values greater than
0.6 (Figures 3b and 3c). Therefore, it is reasonable to specify
a threshold value of 0.6 to separate medium-high intensity
urban and the other land cover classes. For a given
NDVI
time
series, once the
MVC NDVI
value dropped below 0.6, it would
imply an urban change event in that year. We started with a
0.6 threshold, and then evaluated different threshold values
ranging from 0.5 to 0.7 for sensitivity analysis. This simple-
threshold method may not produce accurate results for
detecting urban intensification processes that involve changes
from low intensity urban (
NLCD
class = 22) to medium-high
intensity urban, because low intensity urban class shows a
largely scattered
NDVI
distribution (0.1–0.9) (Figure 3d).
Detection of No-Change Pixels
NLCD
data have relatively high accuracy for medium-high
intensity urban class (Irwin and Bockstael 2007), but change
pixels identified from
NLCD
2001–2011 may still include false
Figure 3. Histograms of
NDVI
values for (a) medium/high intensity urban; (b) vegetation (forests and agriculture); (c) low
intensity urban; (d) developed open space.
718
October 2019
PHOTOGRAMMETRIC ENGINEERING & REMOTE SENSING


