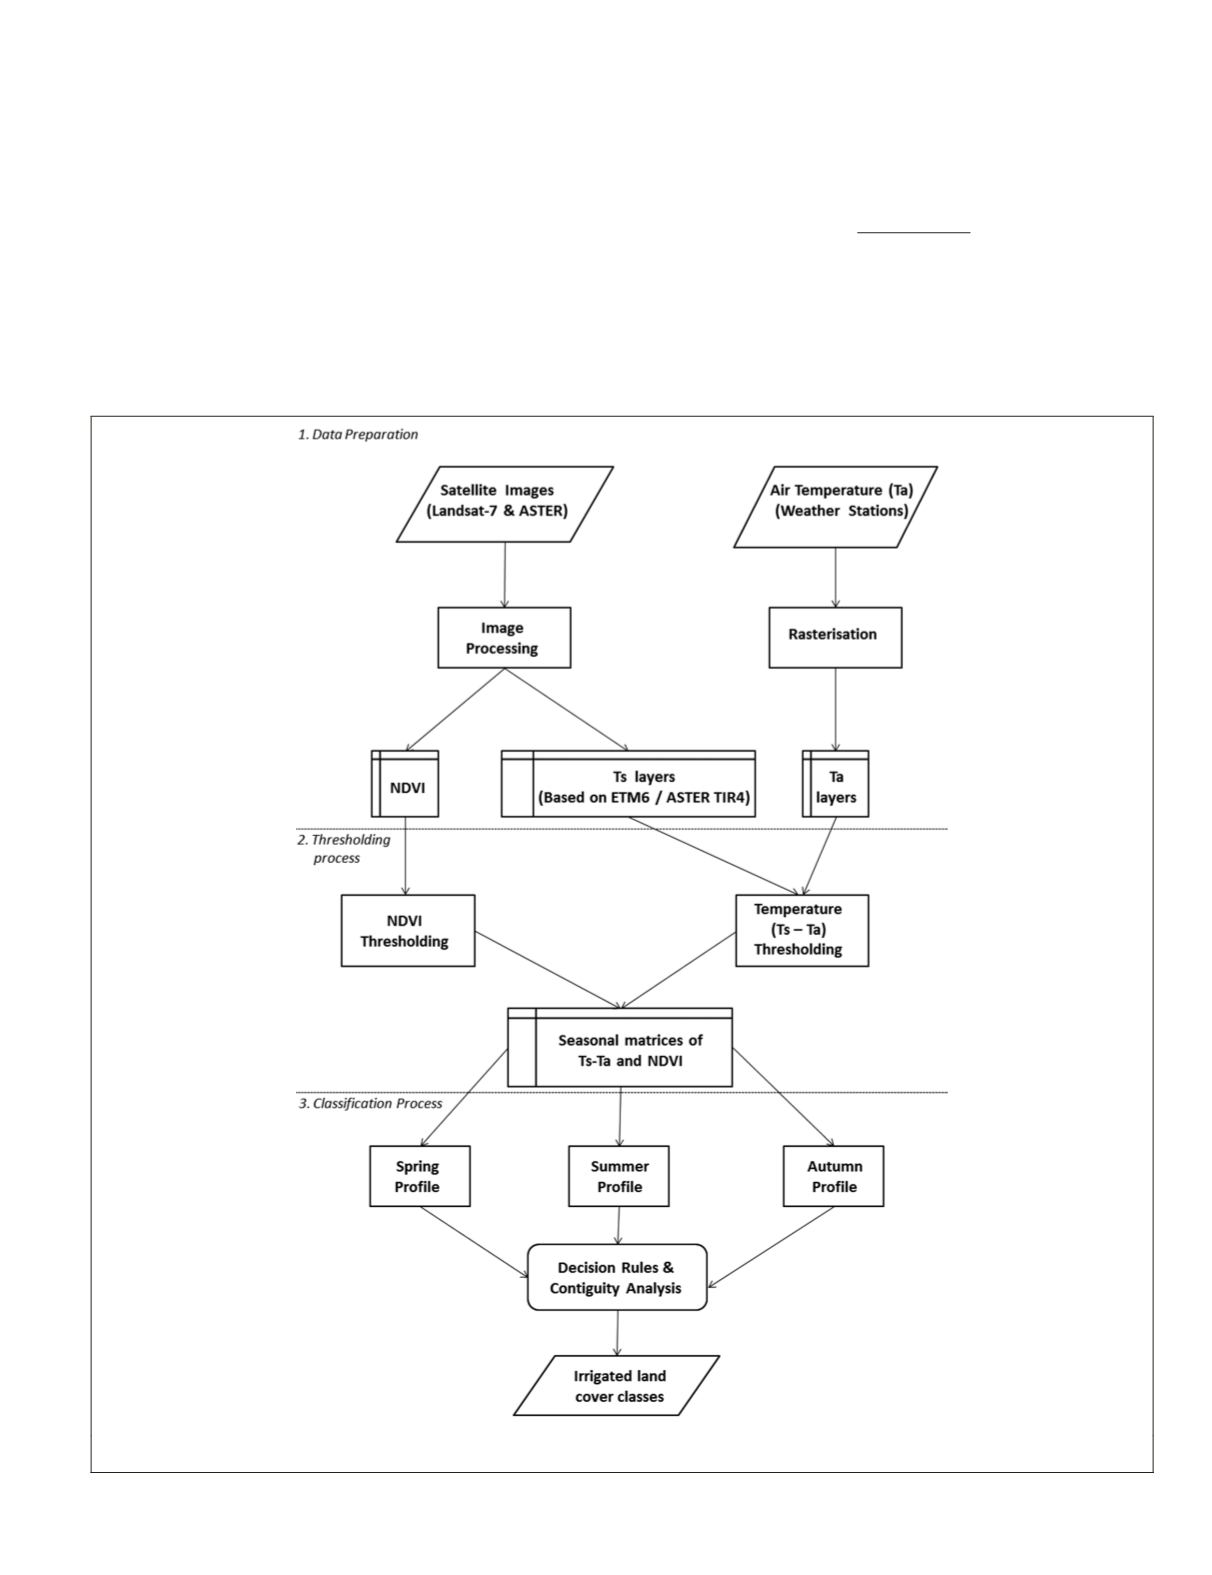
Second, a thresholding process was adopted to identify rela-
tive differences of surface temperature and vegetation status,
that were then compiled as seasonal matrices for the next step.
As a third step, seasonal profiles of farmlands were created us-
ing seasonal matrices to generate irrigated land cover classes.
Data Preparation
Satellite images were acquired to represent the three seasons
of the 2012/2013 crop year, with the designated time frame as
follows: Spring (01 September to 30 November 2012), sum-
mer (01 December 2012 to 28 February 2013), and autumn (01
March to 31 May 2013). Eight Landsat-7 and four ASTER im-
ages were used (Table 1). Landsat-7 images had data gaps due
to scan line corrector (SCL) off mode. Multiple images within
each season were used to infill any data gaps due to SCL or
cloud conditions.
Normalized Difference Vegetation Index (NDVI)
For vegetation status, NDVI was calculated using reflectance
of near infrared (NIR) and red bands (Miura
et al
., 2013). The
following formula was used to calculate at-sensor top of the
atmosphere (TOA) reflectance (Chander
et al
., 2009):
ρ
θ
λ
λ
λ
π
=
⋅
⋅
⋅
L d
2
ESUN cos
s
(1)
where:
ρ
λ
= Planetary TOA reflectance,
π
= Mathematical con-
stant equal to ~3.14159,
L
λ
= Spectral radiance [W/ (m
2
sr μm)],
d
= Earth-Sun dis-
tance [Astronomical units],
ESUN
λ
= Mean exoatmospheric solar irradiance [W/ (m
2
μm)], and
θ
s
= Solar zenith angle [degrees].
Figure 1. Flowchart showing classification process of irrigated farmlands.
PHOTOGRAMMETRIC ENGINEERING & REMOTE SENSING
March 2015
231


