software were used to classify the point cloud according the
LAS 1.2 specifications, and 1.5 m resolution bare earth eleva-
tion models were created using the classified ground points by
Esri products in an .img format (
CRMS
-UGA, 2011). The
CRMS
in the Department of Geography at The University of Georgia
and the
IESA
at
GSC
were involved in the planning and post-
processing of the raw image and lidar data and are the sources
of the lidar data used in this study. Other layers used in the
analysis were obtained from public sources listed in Table 2.
Methods
It is assumed that by using the discrete returns from the lidar
data, features with a certain height value above ground can
be detected. Using ArcGIS
®
10, several process models were
created in order to handle the large amount of data processing
(over 228 GB of lidar point cloud data) necessary to perform
the analysis of areas with the highest z-values. First, a model
was developed to transform the 724 .las data files (3.8 billion
data points) into 724 “multipoint” .shp files. These .shp files
were then converted to a raster format (.tif) using another
iterative model based on the maximum value for
z
within
each cell, creating a digital surface model (
DSM
). The pixel
size was selected as 1.5 m in order to correlate with the 1.5 m
DEM
dataset that was created by the commercial lidar vendor,
Photo Science, Inc. ArcMap
®
10 did not provide an iterative
model capable of processing the normalized
DSM
(
nDSM
, also
known as
CHM
, or Canopy Height Model) that is necessary to
determine
z
-values relative to the ground surface (heights).
Therefore, a script was developed using Python programming
language to perform this function, subtracting the
z
-values of
the 724
DEMs
from the 724
DSMs
and creating new rasters that
contained the heights relative to the ground in each cell. This
script was used to create a tool within ArcMap
®
that can be
used in future processing of nDSMs. Another iterative model
was created to extract pixels within the new nDSMs that
contained values greater than 51.8 m (about 170 ft.), because
it was determined that any trees above this height would be
considered uniquely “tall” based on empirical evidence gath-
ered by members of the
ENTS
over many years.
The resulting rasters were mosaicked to create a single
raster image of 17,961 pixels that contained
z
-values greater
than 51.8 m. This raster was then converted back to vector
format (point) and queried for point features that had
z
-values
(heights) between 52 m and 60 m, as it was determined un-
likely for any trees to be higher than 59 m based on reports
from the
ENTS
. The resulting 2,784 point features were then
selected by their location within the Park boundary, exclud-
ing points that may have been within a data tile but not
within the
GRSM
boundary, resulting in 2,178 possible height
values that met the study parameters (Figure 3). At this point,
manual interpretation was employed to remove man-made
features from the processed results, including apparent power
lines. The 1,523 remaining point values were ranked accord-
ing to maximum
z
-values and analyzed as possible individual
tree crowns (Figure 4). If points were arranged in a cluster
of more than two points within a 10 m radius, they were
considered possible tree crowns. By setting the parameter for
a potential site cluster low, it is unlikely that sites would be
overlooked. Using the 2011 high-resolution imagery and the
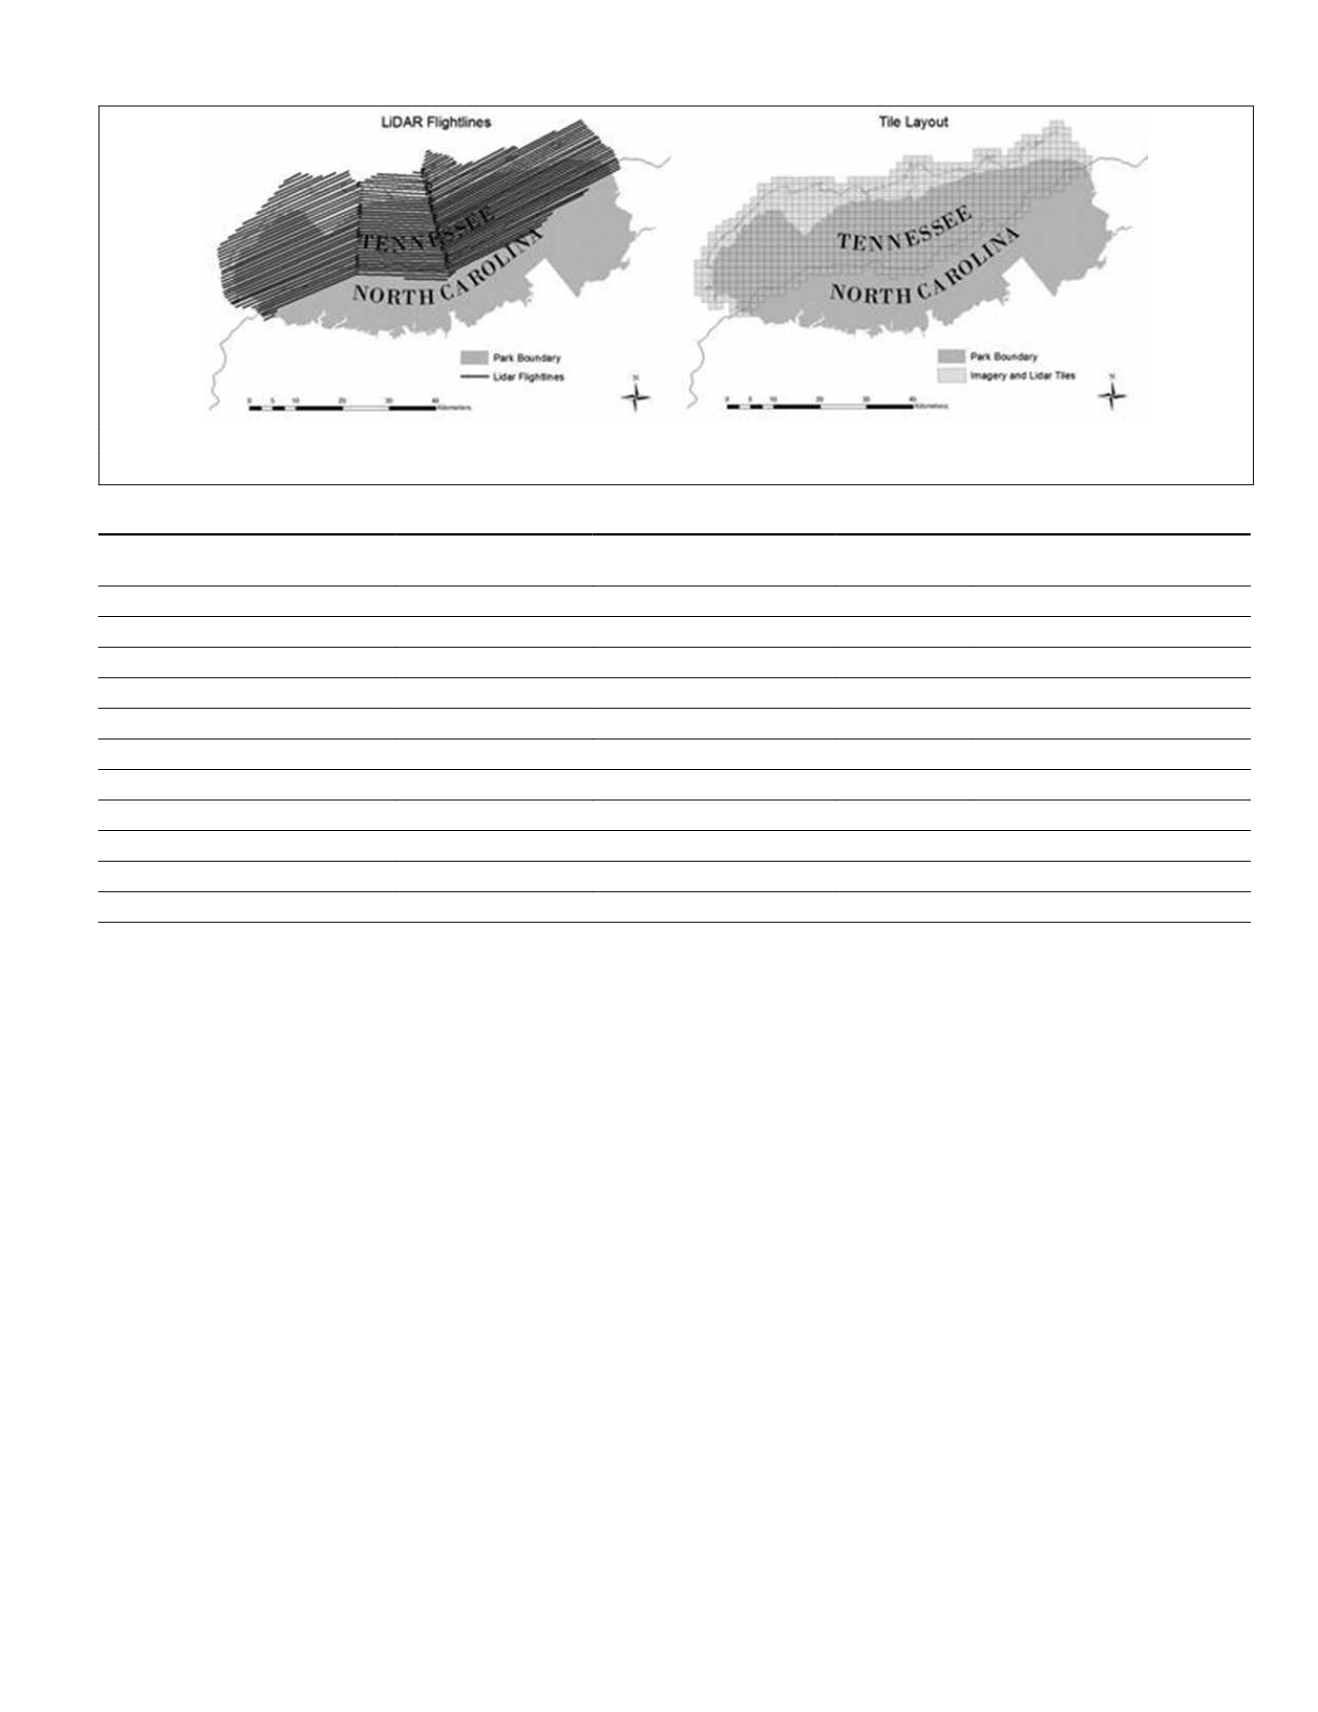
(a) (b)
Figure 2. (a) lidar, and (b) orthoimage data acquisition flight lines and tile layout
T
able
2. D
escription
of
D
ata
U
sed
in
the
S
tudy
Data Layer
Source
Datum and
Projection
Resolution
(m)
Comments
724 .tif files
UGA CRMS 2011 NAD 83 UTM 17N NAVD88
0.3
Digital color images of study area
724 .img files
UGA CRMS 2011 NAD 83 UTM 17N NAVD88
1.5
Lidar-derived DEMs
724 .las files
UGA CRMS 2011 NAD 83 UTM 17N NAVD88
0.69
Vertical RMSE of 0.165 m
statesp020.shp
nationalatlas.gov 2005 Geographic Lat/Long
Projected to NAD 83 UTM 17N
overstory.shp
UGA CRMS 2004
NAD 27 UTM 17N
Vegetation reference map
stream.shp
UGA CRMS 2004
NAD 83 UTM 17N
Stream network map
GRSM_boundary.shp
UGA CRMS 2004
NAD 83 UTM 17N
Park boundary map
Quads27block.shp
UGA CRMS 2004
NAD 83 UTM 17N
USGS Quad map
GRSM_Trail_clip.shp
UGA CRMS 2004
NAD 83 UTM 17N
Park trails map
GRSM_Major_road_hwys.shp
UGA CRMS 2004
NAD 83 UTM 17N
Road network map
Classified_LAS_Point_File_Info.shp UGA CRMS 2004
NAD 83 UTM 17N
Lidar, DEM, and image tile index
PHOTOGRAMMETRIC ENGINEERING & REMOTE SENSING
May 2015
409


