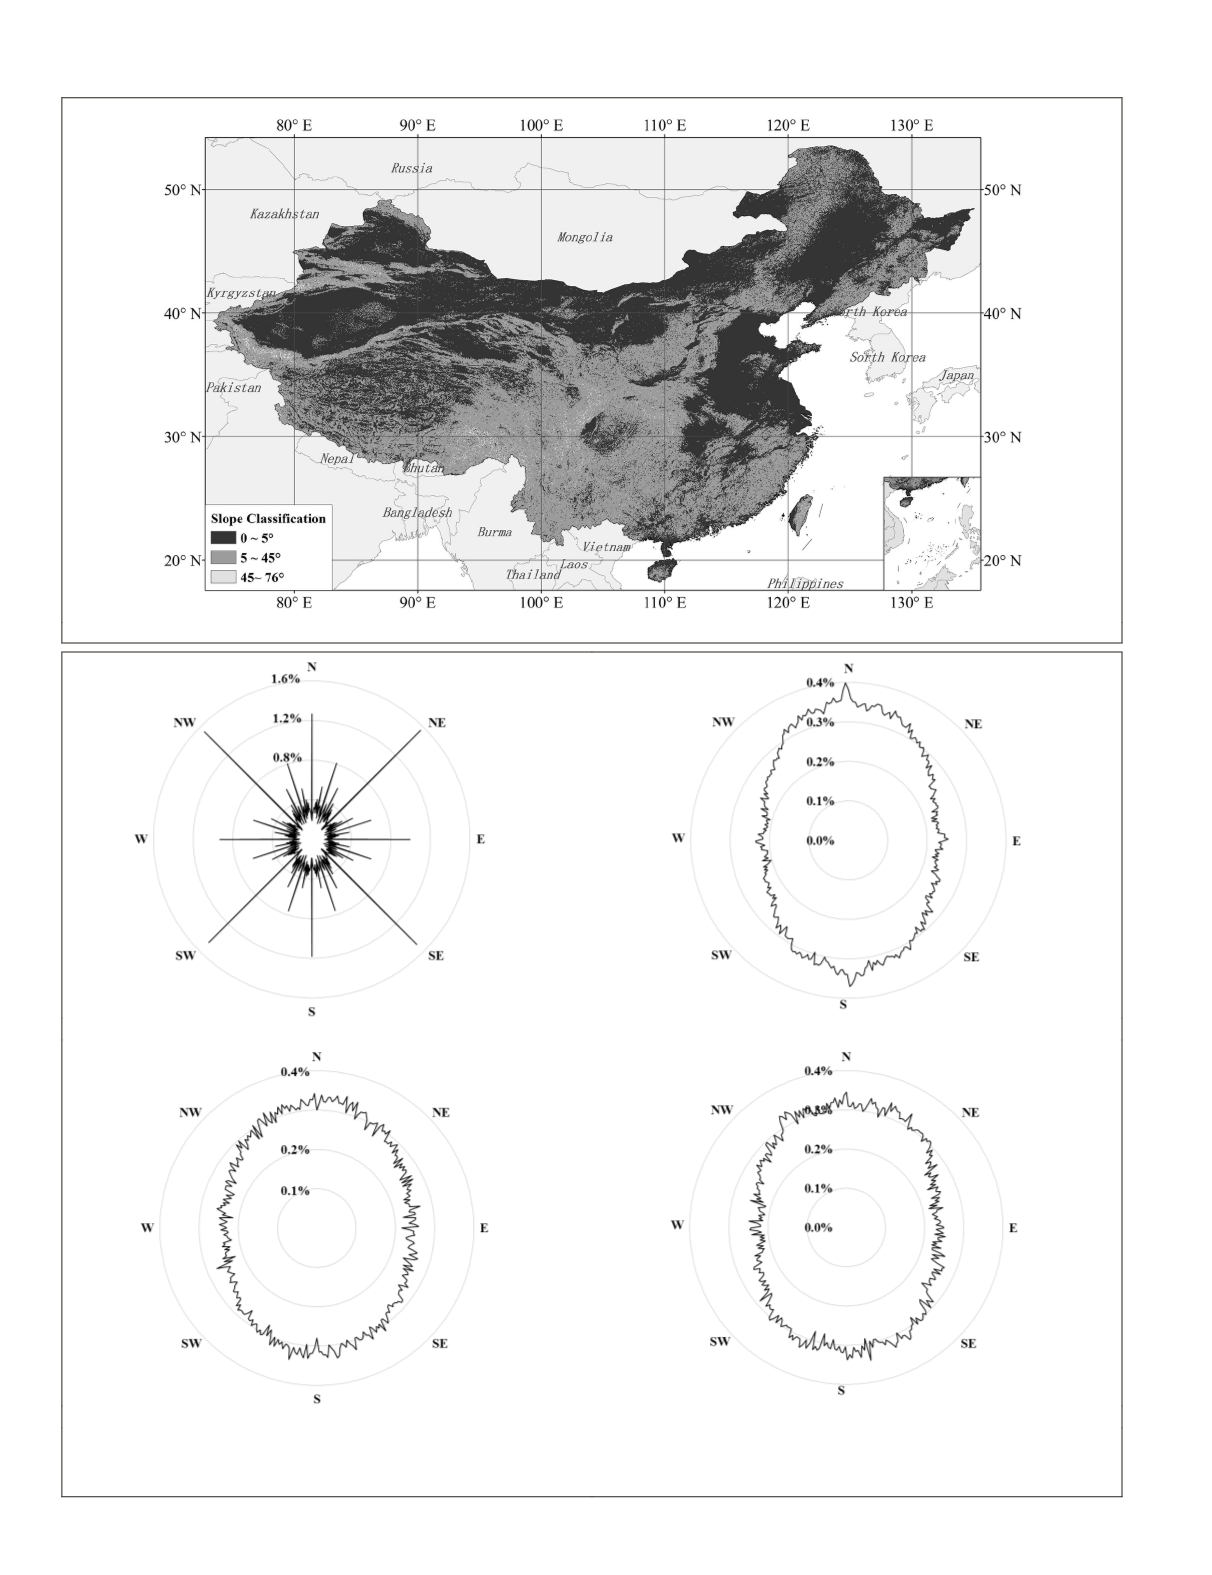
Figure 5. Spatial distribution of three slope levels in China.
(a)
(b)
(c)
(d)
Figure 6. Frequency distribution of aspect of SRTM data and
Hc-
DEM: (a) Aspect of SRTM data (all sample points), (b) Aspect of
Hc-
DEM
(all sample points), (c) Aspect of SRTM data (sample points with slopes greater than 5°, and (d) Aspect of
Hc-
DEM (sample points with
slopes greater than 5°)
140
February 2016
PHOTOGRAMMETRIC ENGINEERING & REMOTE SENSING


