accuracy and the resulting thematic map accuracy, and (e)
synthesis and analysis. This section provides the technical
details for the first four components, and the last one will be
discussed in the next section.
Data Acquisition and Preprocessing
The primary data used in this study was an image subset from
a cloud-free Landsat-8 Operational Land Imager (
OLI
) scene
(Path 19/Row 36) dated on 06 May 2014. The scene covers
the northeastern part of the State of Georgia. The data were
acquired by
USGS
EROS
Data Center and made publically avail-
able at a standard Level-1 product (see
gov/landsat8.php
). By using the information from the meta-
data, we conducted radiometric calibration and rescaled the
raw data into the top of atmosphere radiance (see
-
sat.usgs.gov/Landsat8_Using_Product.php
). Then, we used
the
FLAASH
method to convert the top of atmosphere radiance
value into the ground reflectance and reduce the atmospheric
effects (see ENVI, 2009). This preprocessing procedure is
necessary so that representative training and test (or refer-
ence) samples for specific land cover classes can be correctly
selected, which will be discussed later.
The original data were initially rectified in geometry by
USGS
EROS
Data Center, and the root mean square error (
RMSE
)
should be around three to four pixels. Here we further imple-
mented a geometric correction procedure using the high
resolution orthoimagery dataset generated by
USGS
in April
2008 as the reference. Ten ground control points were carefully
selected across the image, and the nearest-neighbor resampling
was applied with a first-degree polynomial fit. The average root
mean squared error (
RMSE
) was 0.04 pixels. The image is cast to
the Universal Transverse Mercator (
UTM
) projection (Zone 17N)
and referenced to the North American Datum (
NAD
) 1983.
The image actually used in this study was a subset cov-
ering the Gwinnett County in Georgia, with a total area of
approximately 1,122 square kilometers. Seven visible and
reflected infrared bands including coastal aerosol, blue, green,
red, near infrared, and
SWIR
(short wave infrared) 1 and 2 (all
with 30 m spatial resolution) were used here, while excluding
the panchromatic, cirrus, and thermal infrared (
TIRS
) bands be-
cause we intended to focus on the visible and near-mid infrared
portion of the electromagnetic spectrum. Note that for Landsat
8, thermal data are acquired through a separate sensor, i.e., the
TIRS
sensor; because of the relatively coarse spatial resolution,
we eventually excluded the thermal bands in this study.
To help the classification scheme design and training
sample selection, we collected several ancillary datasets
including the National Land Cover Database 2011 (
NLCD
2011)
from
USGS
and a detailed land use database created by the
Atlanta Regional Commission (ARC, 2014) through on-screen
photo-interpretation and digitizing of orthorectified aerial
photography with 1 m pixel size for 2001 and 0.5 m for 2010.
In addition, we also made use of high-resolution satellite im-
ages available from Google Earth
™
.
Finally, we collected field data to assist land cover clas-
sification and thematic accuracy assessment. We conducted
two field trips across the entire study area in December 2010
and May 2011. The field itineraries were designed accord-
ing to our knowledge about the study area and a preliminary
examination of the satellite image. During the fieldtrips, we
recorded geographic positions and land cover types at each
observation location with a Trimble
GPS
receiver.
Classification Scheme and Training Samples
An examination of the information derived from the field
survey and the reference data revealed that the image sub-
set covers a complex mosaic of urban, suburban, and rural
landscapes, thus allowing a rigorous test of the robustness of
random forests in classifying heterogeneous landscapes. The
goal here was to distinguish major spectrally inherent classes
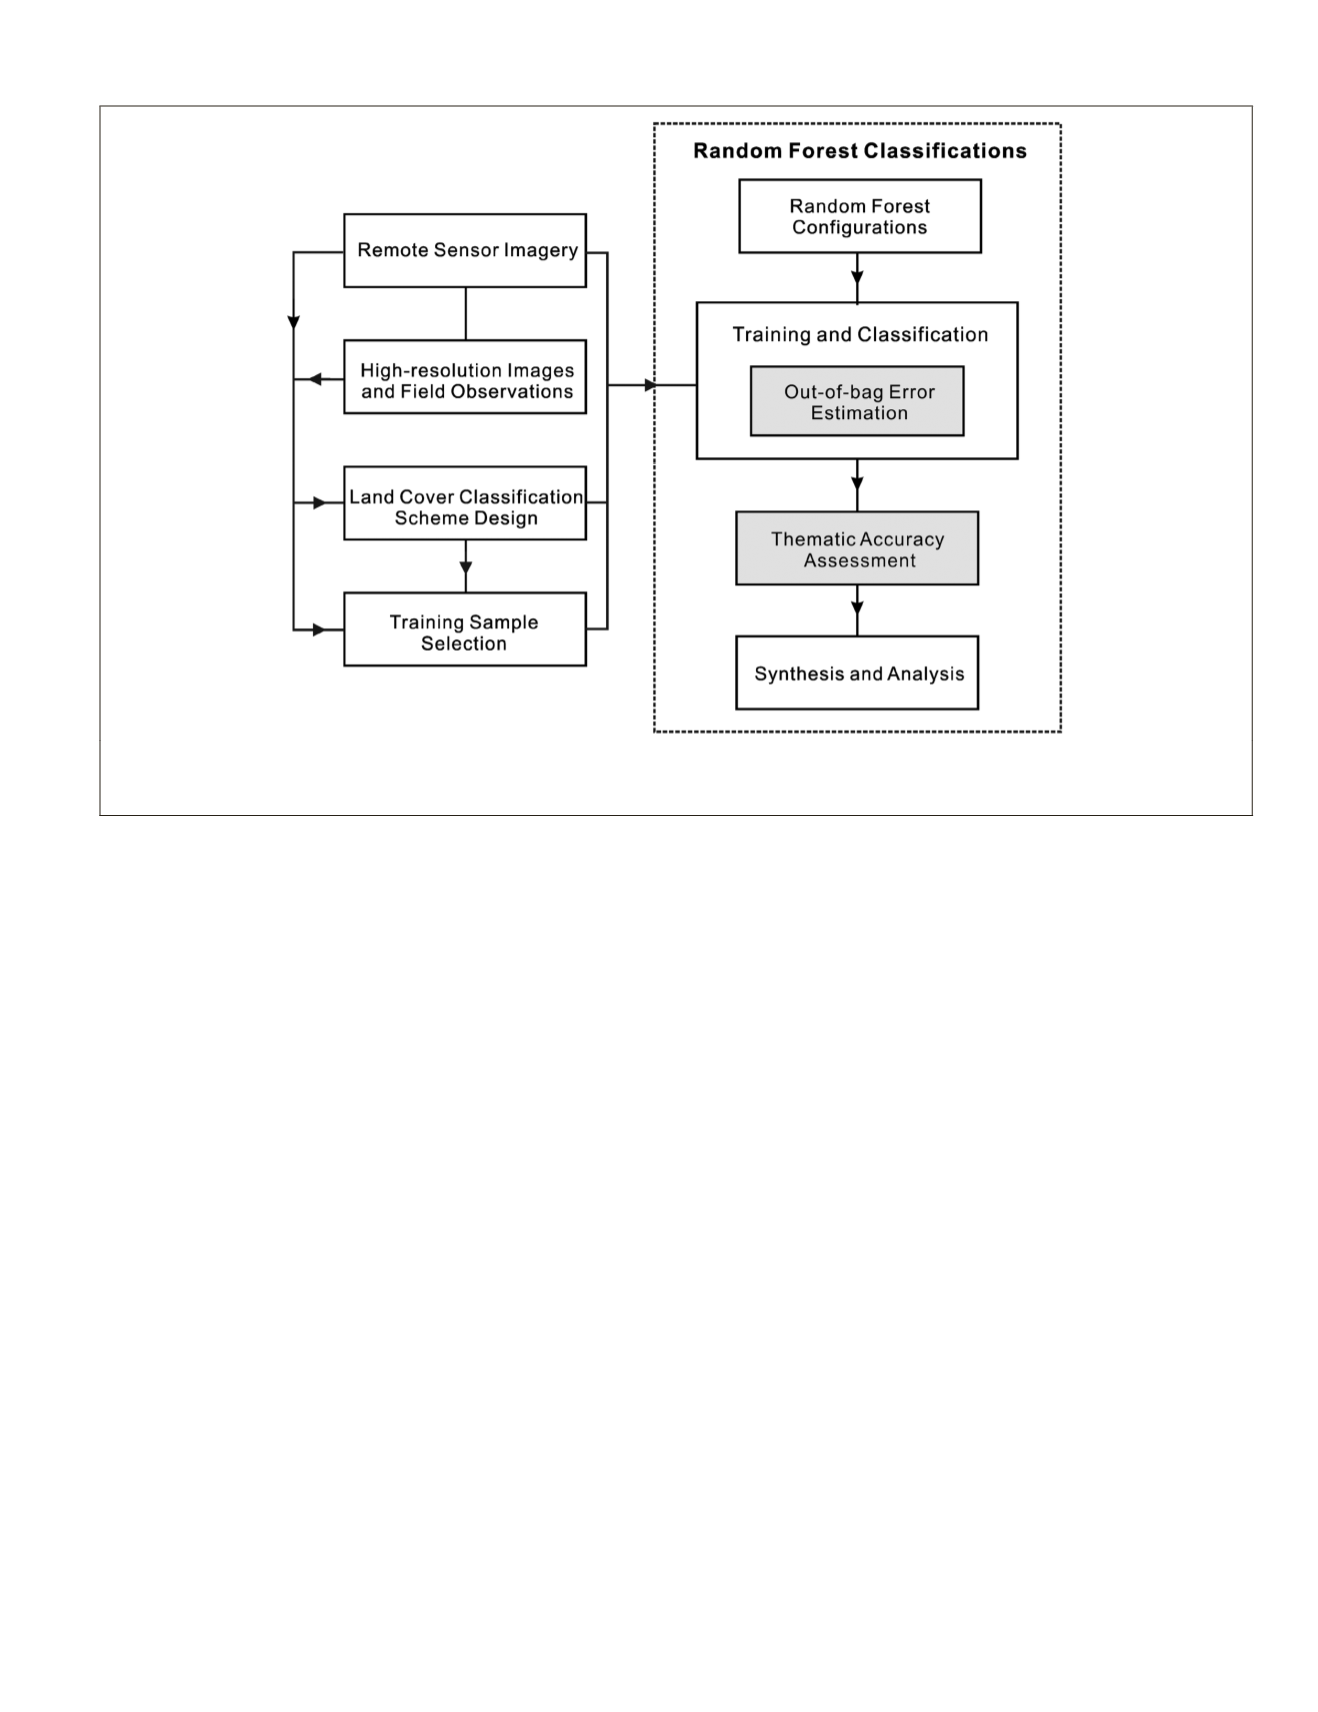
Figure 1. Flowchart of the working procedural route used in this study. It consists of several major components: remote sensed data ac-
quisition and preprocessing, land-cover classification scheme design and training sample selection, random forest configuration, training
and land cover classification, evaluations of the classifier’s performance and the thematic map accuracy, and synthesis and analysis.
PHOTOGRAMMETRIC ENGINEERING & REMOTE SENSING
June 2016
409


