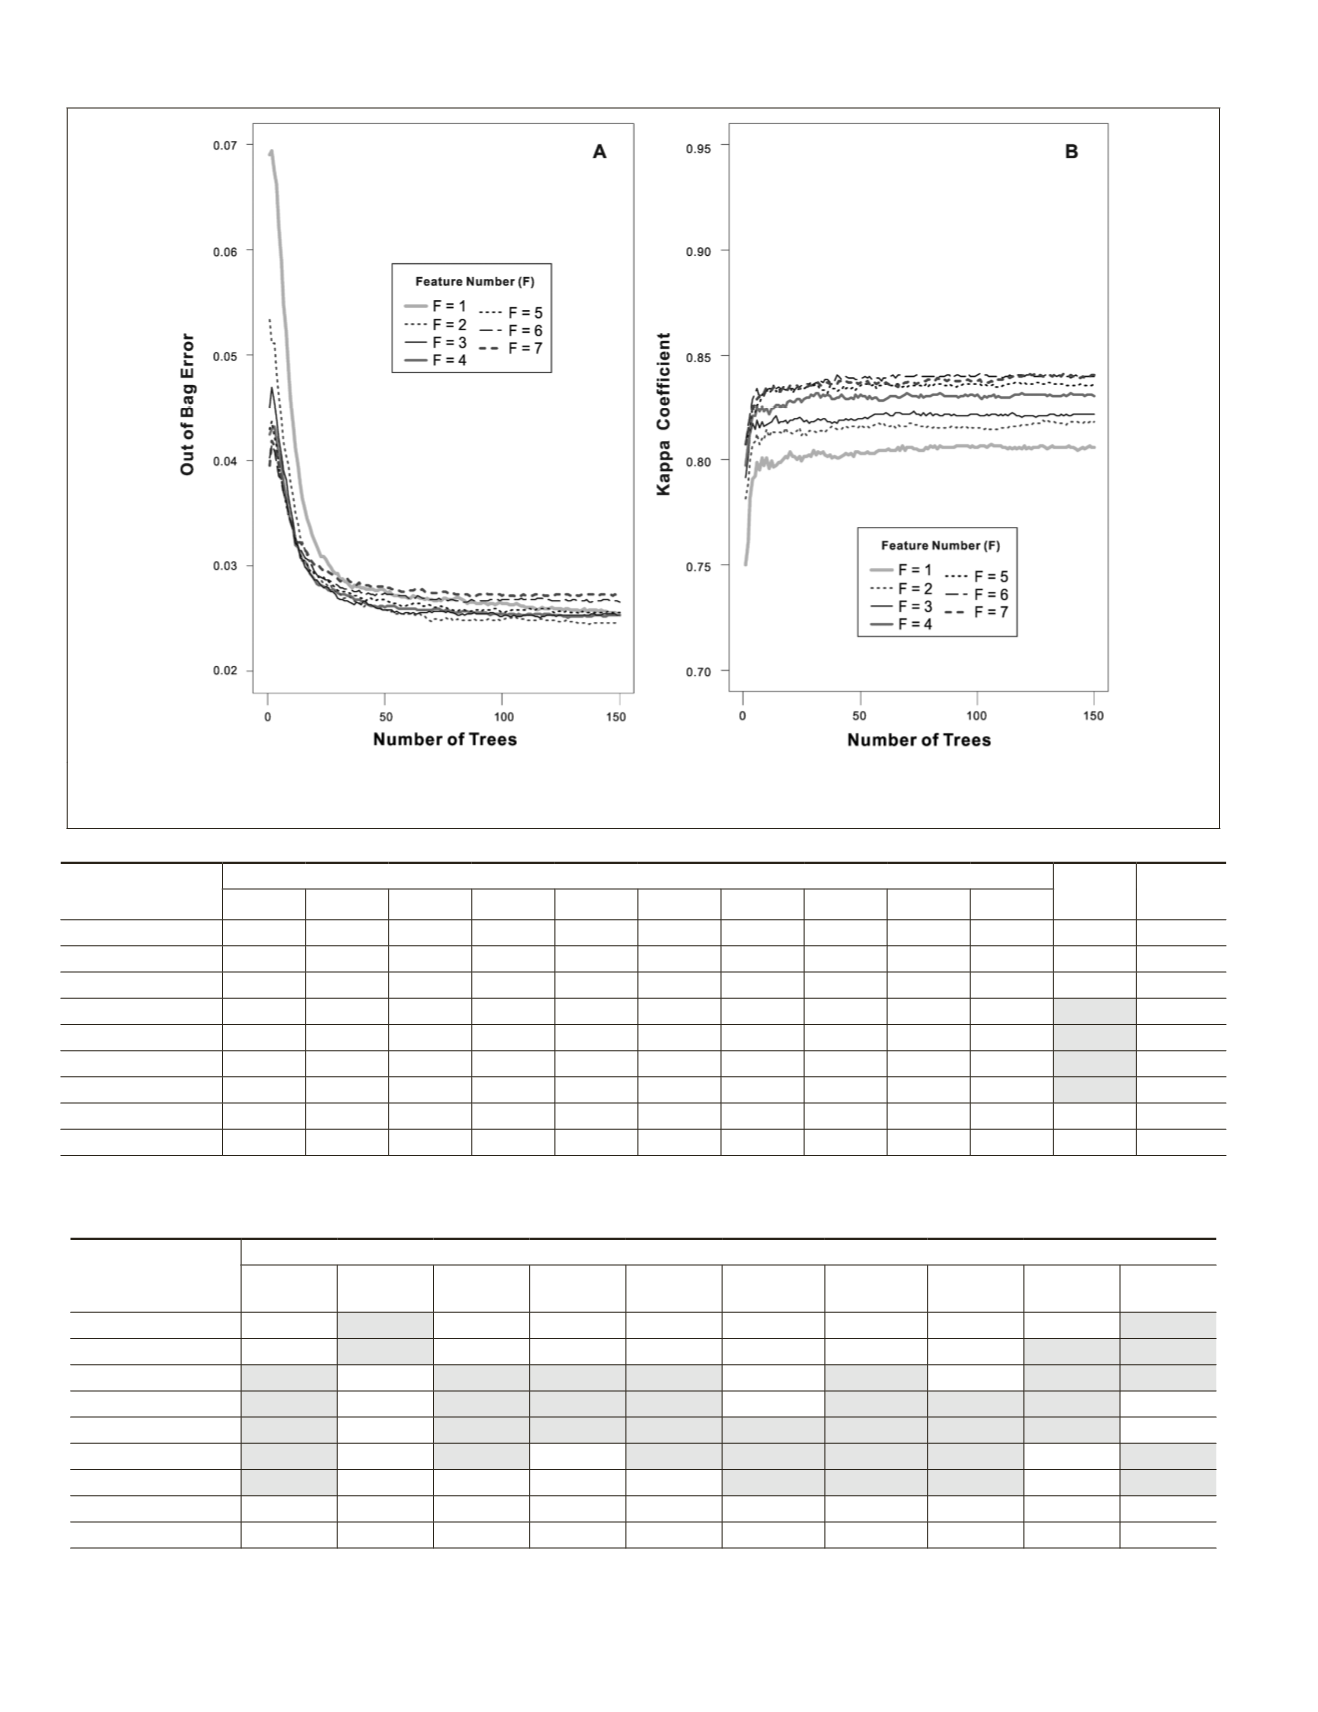
Figure 4. Classifier’s accuracy and thematic map accuracy in relation to the tree number and the feature number. A. Classifier’s accu-
racy measured by the out-of-bag error for each tree number that was averaged for ten random seeds. B. Map accuracy quantified by the
Kappa coefficient for each tree number that was averaged for ten random seeds.
T
able
3. K
appa
C
oefficients
in
R
elation
to
F
eature
N
umbers
and
R
andom
S
eed
N
umbers
Feature
Number
Random Seed Number
Mean Standard
deviation
1
2
3
4
5
6
7
8
9
10
1
0.8028 0.8060 0.8025 0.7958 0.8035 0.8075 0.8059 0.7972 0.8048 0.8063 0.8032 0.0039
2
0.8160 0.8193 0.8121 0.8188 0.8164 0.8118 0.8153 0.8128 0.8148 0.8119 0.8149 0.0028
3
0.8178 0.8189 0.8175 0.8217 0.8257 0.8214 0.8177 0.8172 0.8189 0.8240 0.8201 0.0030
4
0.8294 0.8282 0.8250 0.8350 0.8358 0.8224 0.8310 0.8292 0.8245 0.8305 0.8291 0.0043
5
0.8426
0.8314
0.8379
0.8351 0.8298 0.8308 0.8371 0.8351 0.8333 0.8306 0.8344 0.0040
6
0.8390
0.8397
0.8356
0.8402 0.8405 0.8397
0.8350
0.8405
0.8312
0.8382 0.8380
0.0031
7
0.8396 0.8340 0.8372 0.8361 0.8370 0.8353
0.8388
0.8337
0.8366
0.8379 0.8366
0.0019
Mean
0.8268 0.8254 0.8240 0.8261 0.8270 0.8241 0.8258 0.8237 0.8235 0.8256 0.8252 0.0033
Standard deviation
0.0150 0.0114 0.0139 0.0155 0.0131 0.0119 0.0128 0.0153 0.0114 0.0124
* The kappa coefficients shown in the table were averaged using tree numbers ranging from 1 to 150. The best accuracies in each comparative
category are in bold. And the shaded cells in Column Mean represent accuracies equal to or greater than the mean.
T
able
4. C
onditional
K
appa
C
oefficients
in
R
elation
to
F
eature
N
umbers
.
Feature
Number
Land Cover Classes
Intensive
urban
Extensive
urban
Barren
land
Grass-
land
Pasture
Evergreen
forest
Deciduous
forest
Mixed
forest
Wetland
forest
Water
1
0.9422
0.7509
0.8998 0.6767 0.5869 0.8832
0.9762 0.6366 0.8548 0.9700
2
0.9487 0.7406 0.9094 0.6918 0.6168 0.8698
0.9757 0.6706 0.8896 0.9714
3
0.9547 0.7335 0.9209 0.6957 0.6265 0.8654
0.9786 0.7000
0.8906
0.9622
4
0.9550 0.7337 0.9227
0.7028 0.6329
0.8835
0.9798 0.7470 0.8903 0.9495
5
0.9568 0.7311
0.9247 0.7028
0.6301 0.9046
0.9794 0.7939 0.8883 0.9279
6
0.9569
0.7346 0.9145 0.689 0.6235 0.9439
0.9803 0.7998
0.8630 0.9678
7
0.9534 0.733 0.9093 0.6865 0.612
0.9588
0.9802 0.7916 0.8559
0.9785
Mean
0.9525 0.7368 0.9145 0.6922 0.6184 0.9013
0.9786 0.7342 0.8761 0.9610
Standard deviation
0.0053 0.0069 0.0090 0.0093 0.0157 0.0366
0.0019 0.0659 0.0172 0.0172
* Each number in this table was the average using the tree number ranging from 1 to 150 and 10 random seeds. The best accuracies in each
comparative category are in bold. And the shaded cells represent accuracies equal to or greater than the mean.
414
June 2016
PHOTOGRAMMETRIC ENGINEERING & REMOTE SENSING


