This is understandable since random forests as a classifier
gradually converge by combining results of unpruned full-
grown decision trees; when the tree number equals to one,
the single unpruned tree classifier turns out to have lower
performance and hence higher
OOB
error than ensemble mod-
els using more than one tree. The
OOB
error dropped sharply
as more trees were used. This declining trend became slower
after more than 30 trees were used, and the
OOB
error became
quite stable as more than 50 trees were used. Note that the
overall
OOB
error level was quite low, varying from 0.026 to
0.048, which equals to 95.2 percent ~ 97.4 percent in terms
of the classifier’s accuracy; the
OOB
error range was 0.022,
corresponding to 2.2 percent in the classifier’s accuracy. Such
low
OOB
error level and a small absolute variation suggest that
the impact of the tree number upon the classifier’s accuracy
was quite limited. This observation is in line with the finding
from several existing studies (e.g., Breiman, 2001; Pal, 2003;
Lawrence
et al.
, 2006; Puissant
et al
., 2014).
In addition to the
OOB
error, we computed the overall
Kappa coefficient for each tree number tested that was aver-
aged for the feature number ranging from 1 to 7 with 10
random seeds. Figure 2B shows the trend of the overall Kappa
coefficient in relation to the tree number tested. Similar to the
trend in the classifier’s accuracy measured with the
OOB
error,
the thematic map accuracy measured with the Kappa coef-
ficient increased as more trees were used. The overall Kappa
coefficient was the lowest (about 0.79) when only one tree
was used, and then increased to 0.82 when seven trees were
used. But it somewhat fluctuated around 0.82 when the tree
number was increased from 7 through 20. The metric became
stable after more than 20 trees were used. Note that the overall
Kappa coefficient ranged from 0.79 to 0.83, with the absolute
variation of 0.04 (or 4 percent in terms of the thematic map
accuracy) and the percentage variation of 5.06 percent, sug-
gesting that the impact of the number of trees on the overall
map accuracy was moderate. The Z-test results indicate that
there is no significant difference between the classification ac-
curacies by random forest models with changing tree numbers
(Table 2). This is not surprising if we only consider the overall
Kappa coefficient variation after the classifier became stable
using at least 20 trees, which ranged from 0.82 to 0.83. Nev-
ertheless, the classification accuracy varied moderately when
using fewer than 20 trees, ranging from 0.79 to 0.82.
Finally, we examined the conditional Kappa coefficient for
each land cover class in relation to the tree number tested.
Note that this metric was also averaged for the feature number
ranging from 1 to 7 with 10 random seeds (Figure 3). Based
on Figure 3, it is clear that most spectrally homogenous land
cover categories such as deciduous forest, intensive urban,
and water tend to be classified with much higher accura-
cies, while heterogeneous classes such as pasture, grassland,
mixed forest, and extensive urban tend to have lower accura-
cies. This is in line with the observation of many traditional
classifiers (e.g., maximum likelihood classifier) and other
advanced pattern classifiers such as support vector machines
(e.g., Yang, 2011). Moreover, some homogenous classes such
as deciduous forest, intensive urban, and barren land only
needed a few trees (five or so) to become stable in terms of the
thematic map accuracy, while some heterogeneous categories
such as wetland forest, extensive urban, grassland and mixed
forest required more trees (ten or more).
Based on the above experiments, it is clear that the tree
number can moderately affect the performance of random
forests in labeling unknown pixels, measured with both
overall Kappa and conditional Kappa coefficients. Our study
suggests that random forest models with a moderate number
of trees can generate a stable overall thematic map accuracy.
Moreover, the performance of random forests can be greatly
affected by the level of spectral complexity with respect to
specific land cover classes. More trees are generally needed to
classify spectrally complex land cover categories by random
forests. Nevertheless, using a very large number of trees
(such as hundreds or thousands) did not seem to help further
improve the thematic map accuracy after the performance of
random forests became stable. Instead, the possible benefit
of using more trees may be overshadowed with a greater
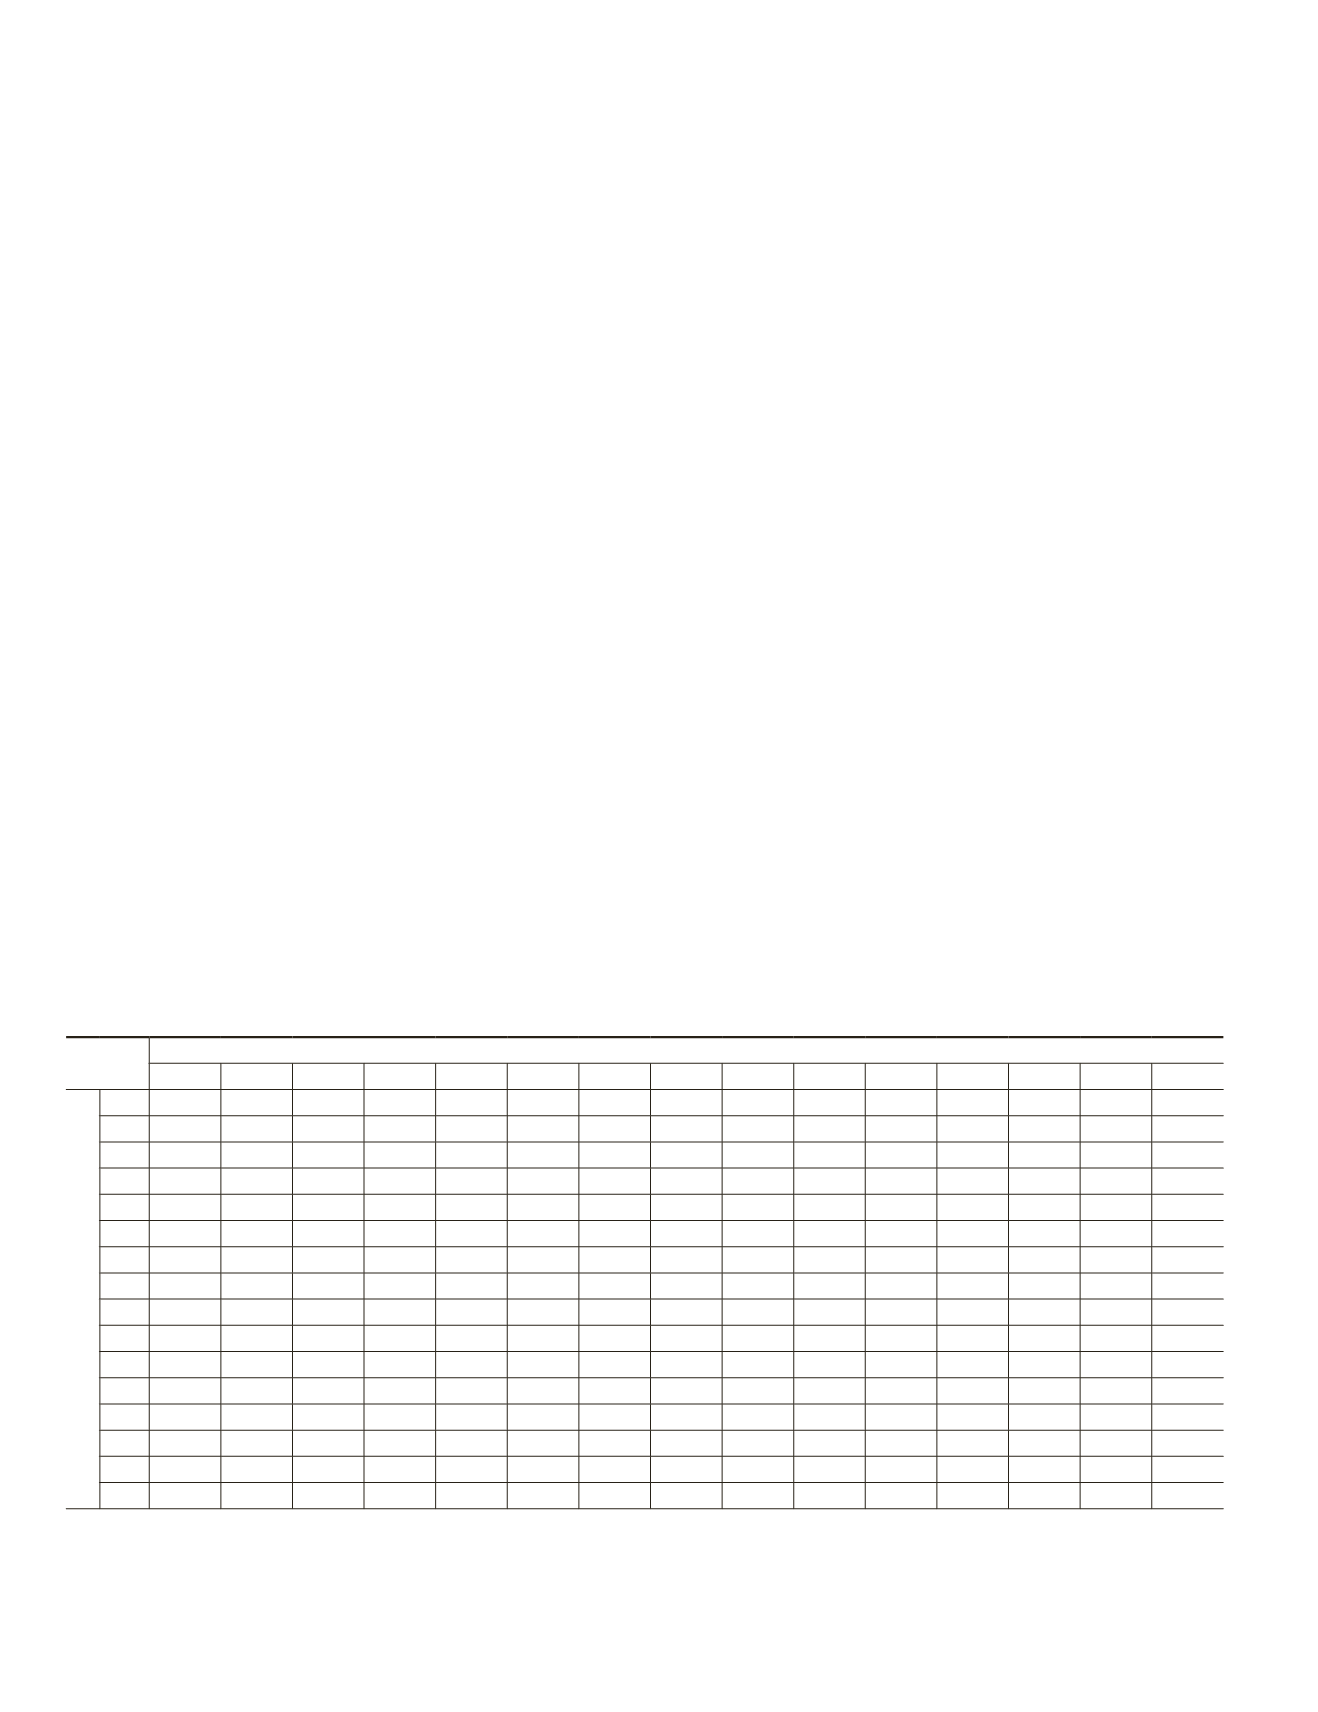
T
able
2. K
appa
A
nalysis
R
esults
for
the
P
airwise
C
omparison
of
the
E
rror
M
atrices
D
erived
from
R
andom
F
orest
M
odels with
D
ifferent
T
ree
N
umbers
.
N
ote
that
16 D
ifferent
T
ree
N
umbers
,
i
.
e
., 1, 10, 20, 30, 40, 50, 60, 70, 80, 90, 100, 110, 120, 130, 140,
and
150,
were
C
onsidered
, U
sing
S
ix
F
eatures
and
the
F
irst
R
andom
S
eed
Z
Statistic
Tree Numbers
10
20
30
40
50
60
70
80
90 100 110 120 130 140 150
Tree Numbers
1 1.7285 1.7284 1.7284 1.8939 1.7284 1.6462 1.8110 1.6462 1.4830 1.5644 1.4829 1.5644 1.6462 1.6461 1.7284
10
0.0000 0.0000 0.1657 0.0000 0.0822 0.0826 0.0822 0.2455 0.1641 0.2455 0.1641 0.0822 0.0822 0.0000
20
0.0000 0.1657 0.0000 0.0822 0.0826 0.0822 0.2455 0.1641 0.2455 0.1641 0.0822 0.0822 0.0000
30
0.1657 0.0000 0.0822 0.0826 0.0822 0.2455 0.1641 0.2455 0.1641 0.0822 0.0822 0.0000
40
0.1657 0.2479 0.0830 0.2479 0.4112 0.3297 0.4111 0.3297 0.2479 0.2479 0.1657
50
0.0822 0.0826 0.0822 0.2455 0.1641 0.2455 0.1641 0.0822 0.0822 0.0000
60
0.1648 0.0000 0.1633 0.0818 0.1633 0.0818 0.0000 0.0000 0.0822
70
0.1648 0.3281 0.2467 0.3281 0.2467 0.1648 0.1648 0.0826
80
0.1633 0.0818 0.1633 0.0818 0.0000 0.0000 0.0822
90
0.0814 0.0000 0.0814 0.1633 0.1633 0.2455
100
0.0814 0.0000 0.0818 0.0818 0.1641
110
0.0814 0.1633 0.1633 0.2455
120
0.0818 0.0818 0.1641
130
0.0000 0.0822
140
0.0822
150
* We have prepared a separate table for each feature number when examining the impact of the tree number on random forest classification.
Because we considered seven different feature numbers, we have prepared seven tables. Note that this table is an example summarizing the
Z-statistic when using six features as our experiment indicates that the random forest models equipped with moderate tree numbers and six
features performed the best.
412
June 2016
PHOTOGRAMMETRIC ENGINEERING & REMOTE SENSING


