that a random forest model using seven features is actually
incorporating all features without a random selection of fea-
tures at each node, which equals to a bagging model. Although
some earlier studies suggest that random forests generally out-
perform a bagging method (e.g., Hamza and Larocque, 2005),
our current study indicates that they performed identically,
which is line with the findings from several other studies (e.g.,
Gislason,
et al
., 2006; Ghimire
et al
., 2013; Li
et al
., 2014).
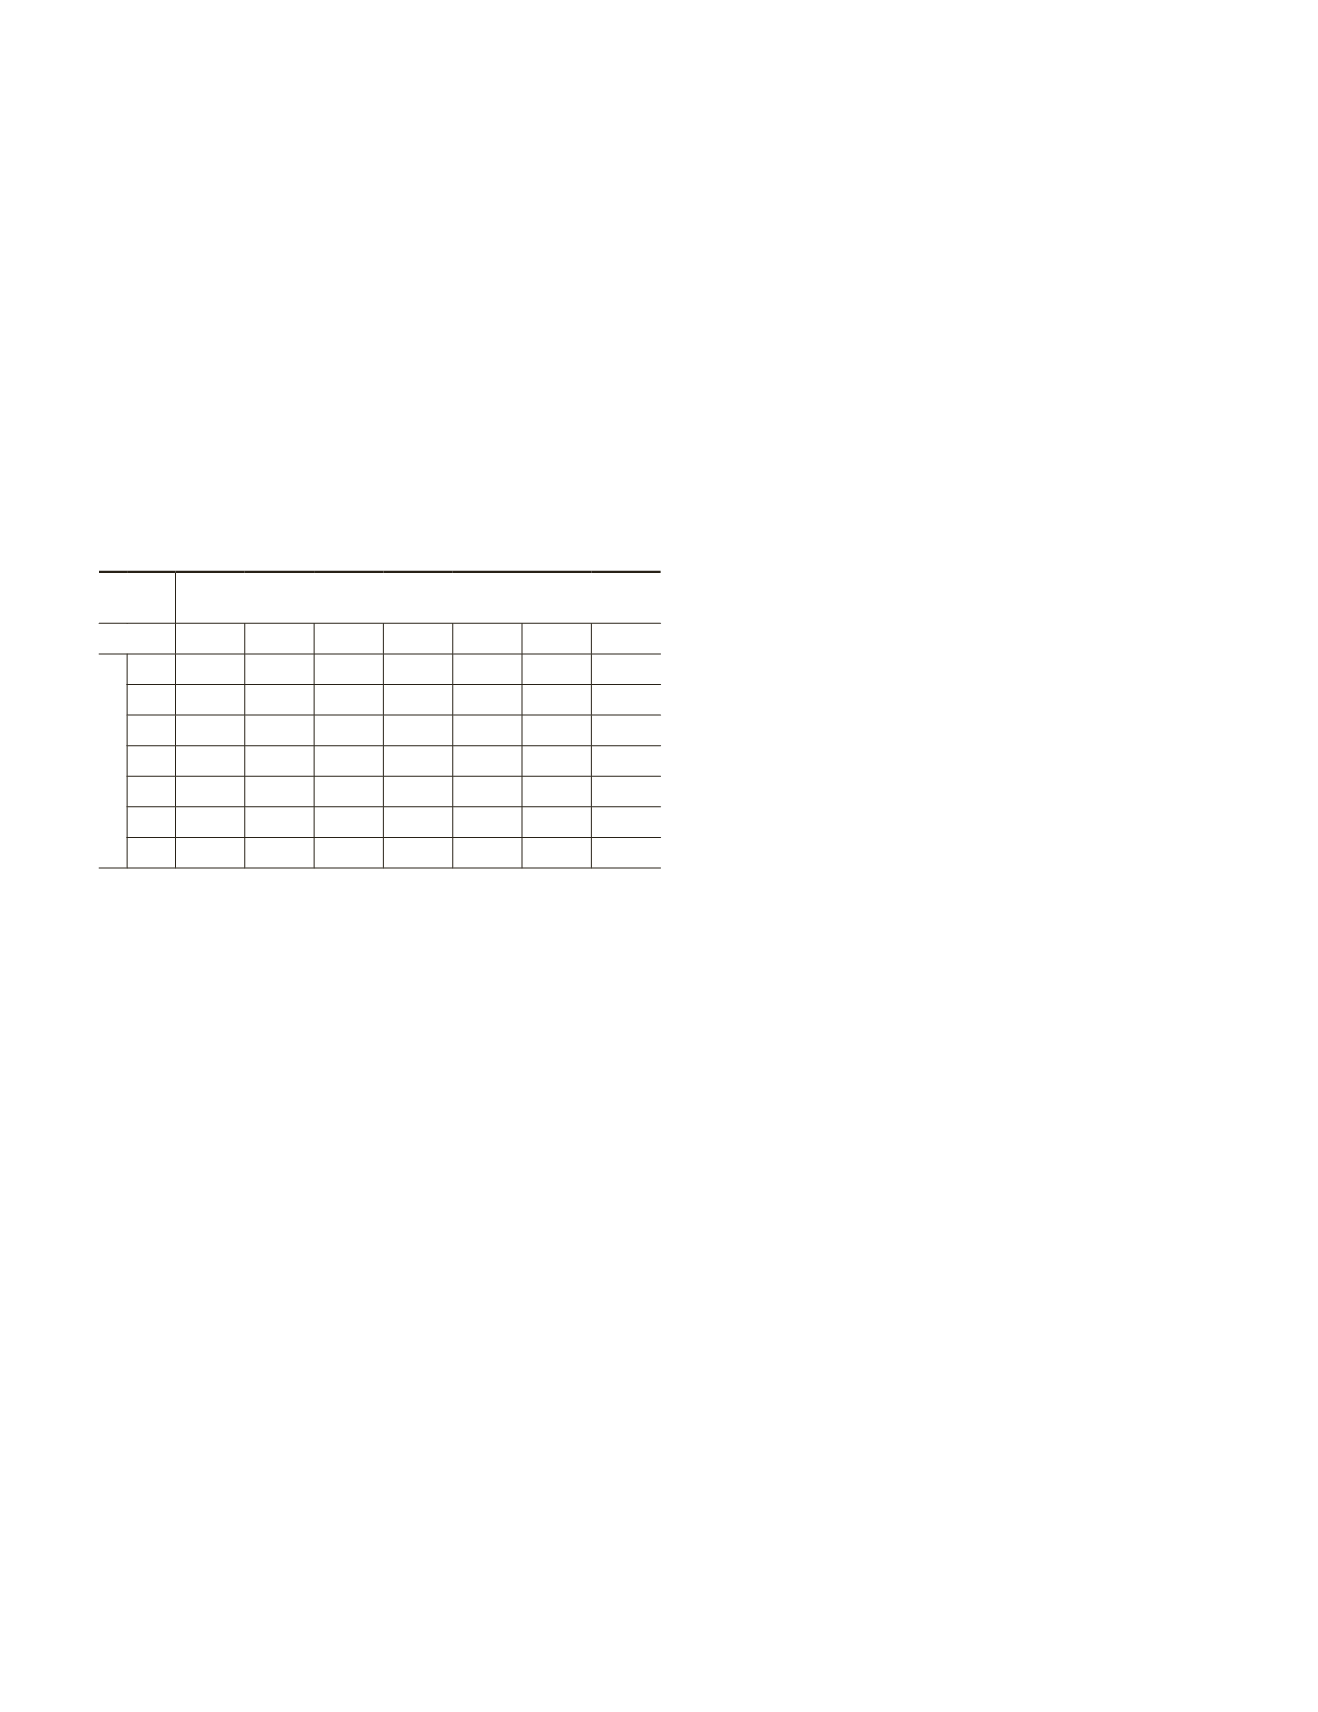
Furthermore, the Z-test results show that using one feature can
lead to statistically significant differences in classification ac-
curacy compared to the results derived using six or seven fea-
tures. Our experiment indicates that the random forest models
equipped with six features generally performed better, and the
Z-statistic suggests closer classification results between using
larger feature numbers and using six features (Table 5).
T
able
5. K
appa
A
nalysis
R
esults
for
the
P
airwise
C
omparison
of
the
E
rror
M
atrices
D
erived
from
R
andom
F
orest
M
odels with
D
ifferent
F
eature
N
umbers
. N
ote
that
S
even
D
ifferent
F
eature
N
umbers
,
i
.
e
., 1, 2, 3, 4, 5, 6,
and
7,
were
C
onsidered
, U
sing
40
trees
and
the
F
irst
R
andom
S
eed
. T
hose
being
significantly
D
ifferent
are
in
B
old
Z
Statistic
Feature Numbers
1
2
3
4
5
6
7
Feature Numbers
1
0.9865 1.0644 1.4590 1.8624
2.1917 2.1087
2
0.0780 0.4727 0.8762 1.2058 1.1228
3
0.3947 0.7982 1.1278 1.0448
4
0.4035 0.7331 0.6501
5
0.3297 0.2467
6
0.0830
7
* We have prepared one table for each tree number used when exam-
ining the impacts of the feature number on random forest classifica-
tion. Because we considered 16 different tree numbers (See Table
2), we have generated 16 tables. Note that this table is an example
summarizing the Z-statistics when using 40 trees as our experiment
showed that the random forest models equipped with 30-40 trees
generated stable overall classification accuracies.
The breakdown of the impact of the feature number on
the classification accuracy for specific land cover categories
is summarized in Table 4. First, most spectrally homogenous
land cover categories such as deciduous forest, intensive
urban, evergreen forest, and water tend to be classified with
much higher thematic map accuracies, while heterogeneous
classes such as pasture, grassland, mixed forest, and extensive
urban tend to have relatively lower accuracies. This is in line
with our observation when examining the impact of the tree
number. Second, although none of the random forest models
won for all land cover categories in terms of the classification
accuracy, the group of models using six features produced
the highest accuracies for three of the ten major classes. This
same group of models also enabled seven of the ten categories
to be classified with the map accuracies equal to or greater
than the average when considering the outcome from all other
groups of models tested. Furthermore, the random forest mod-
els with four or five features were also quite promising since
they enabled at least seven land cover categories to be clas-
sified with the accuracies equal to greater than the average.
Last, the impact of changing feature numbers on specific land
cover classes varied greatly, with mixed forest being the most
sensitive as shown by a variation of 25.64 percent in the clas-
sification accuracy, which was followed by evergreen forest
(10.79 percent), pasture (7.84 percent), water (5.47 percent),
wetland forest (4.28 percent), grassland (3.86 percent), barren
land (2.77 percent), extensive urban (2.71 percent), intensive
urban (1.56 percent), and deciduous forest (0.5 percent). Note
that four of the ten classes had the percentage variation in
the classification accuracy greater than the average (i.e., 4.36
percent, the variation in the overall classification accuracy).
Based on the above experiments, it is clear that the feature
number had a moderate impact on the overall map accuracy
by random forests. However, its impact on specific land cover
classes varied greatly. The random forest models equipped
with a relatively small feature number (i.e., two) and a moder-
ate number of trees (50 or so) produced the lowest classifier
generalization errors in labeling the prototype data. However, a
relatively larger feature number (i.e., six, in our study) coupled
with a moderate number of trees produced the best overall and
categorical classification accuracies by random forests.
Random Seed Number and Classification Accuracy
As mentioned before, while targeting the two algorithmic
factors (i.e., the tree number and the feature number), we also
included another internal parameter, i.e., the random seed
number, in the discussion. Table 3 illustrates the overall Kap-
pa coefficient in relation to specific feature numbers and ran-
dom seed numbers tested. Note that this metric was averaged
for all tree numbers ranging from 1 to 150 included. While
the impact of the feature number was discussed before, here
we direct our attention on the possible impact by the random
seed number. From Table 3, the standard deviations of the
overall Kappa coefficients when using different random seed
numbers varied from 0.0019 (with seven features) to 0.0043
(with four features), with the average of 0.0033. This very
low standard deviation suggests that the random sampling se-
quences generated by random seeds had a very limited impact
on the thematic map accuracy. Another interesting finding
here is that while six features produced the best classification
accuracies (see our previous discussion), seven features seem
to be the most resistant to changing training sample sequences
given the lowest standard deviation, suggesting that a bag-
ging method may be comparatively more stable than random
forests as a classifier.
Summary and Conclusions
The objective of this study has been to assess the impact of
internal parameter settings, particularly the two algorith-
mic factors, i.e., tree numbers and feature numbers, upon
the performance of random forests for remote sensor image
classification. A total of 10,500 random forest models with
different parameter settings have been constructed, and then
used to classify a satellite image into ten major land cover
categories with identical training data. The performance of
random forests as a classifier has been assessed using the
OOB
error measure with prototype data, and the resulting thematic
map accuracy has been examined using the error matrix
analysis with identical reference data. Although the
OOB
error
is commonly used to quantify the classifier’s performance in
the pattern recognition community, the error matrix analysis
with reference samples, widely used in the remote sensing
community, takes the true class proportions on the ground
into consideration, and therefore is considered as a reliable
indicator of the accuracy (Congalton, 1991; Richard, 1996).
Several major findings from this study are summarized
here. First, the algorithmic parameters can noticeably affect
the classification accuracy by random forests. Specific to the
tree number, it can moderately affect the thematic map ac-
curacy, particularly before the classifier became stable. The
other algorithmic parameter, i.e., the feature number, can have
a moderate impact on the thematic map accuracy. We also
included another internal parameter, the random seed num-
ber, in the evaluation, which is found to have a very limited
impact on the map accuracy.
PHOTOGRAMMETRIC ENGINEERING & REMOTE SENSING
June 2016
415


