computational cost, particularly when very large image data-
sets are being processed (see Breiman, 2001; Gislason et al.,
2006; Chan and Paelinckx, 2008; Tang et al., 2008).
Feature Number and Classification Accuracy
We also examined the impact of the feature number on image
classification by random forests. As mentioned earlier, the
entire feature number should be 7 because the image subset
used here includes seven bands. The experimental results
are summarized in Figure 4, Table 3, and Table 4. Figure 4A
illustrates the trend of the
OOB
error for the feature number
ranging from 1 to 7 in relation to the tree number from 1 to
150. Note that this metric was averaged for 10 random seeds.
Based on Figure 4A, the impact of the feature number on the
classifier’s performance was quite limited, particularly after
the classifier gradually converged with 40 to 50 trees used.
And using a small number of features led to a higher initial
OOB
error when fewer trees (less than 20) were used, although
the error level plunged sharply after more than 20 trees were
used. Note that using only one feature indicates a random
split at each node, which was proved to be less favorable ac-
cording to Leo Breiman (Breiman, 2001). In our study, the ran-
dom forest models with only one feature produced the high-
est
OOB
error when fewer trees (less than 20) were used, but
the error level dropped sharply when more trees were used.
When two features were used, the initial
OOB
error was the
second highest, but dropped to the lowest when 50 trees were
used. Using six or seven features produced the lowest initial
OOB
errors but the error level became the highest when more
than 50 trees were used. These observations are in line with
the finding from several existing studies that using a small
number of features or the square root of the entire feature
number could result in optimal classifier’s performance (e.g.,
Breiman, 2001; Lawrence
et al
., 2006; Chan and Paelinckx
2008; Ghosh
et al
., 2014; Rodriguez-Galiano
et al
., 2012).
Figure4B shows the overall Kappa coefficient for the fea-
ture number ranging from 1 to 7 in relation to the tree number
from 1 to 150. Note that this metric was also averaged for ten
random seeds. Different from the classifier’s accuracy, using
medium to large features led to higher thematic map accura-
cies; when the feature number increased from 1 through 5, the
map accuracy showed a moderate increment. The classifica-
tion accuracies for the random forest models equipped with
five through seven features were quite close. Furthermore, a
quantitative comparison can be found from Table 3, in which
“Column Mean” summarizes the overall Kappa coefficient
averaged for the tree number from 1 to 150 with ten random
seeds. From Table 3, the random forest models using six
features produced the highest overall map accuracy (0.838),
which was followed by those using seven features (0.837) and
using five features (0.834). And the overall Kappa coefficient
gradually decreased when the feature number dropped from 4
(0.829) through1 (0.803). The absolute variation and the per-
centage variation in the Kappa coefficient were 0.035 (or 3.5
percent in terms of the classification accuracy) and4.36 per-
cent, respectively, suggesting a moderate impact of changing
feature numbers upon the overall classification accuracy. Note
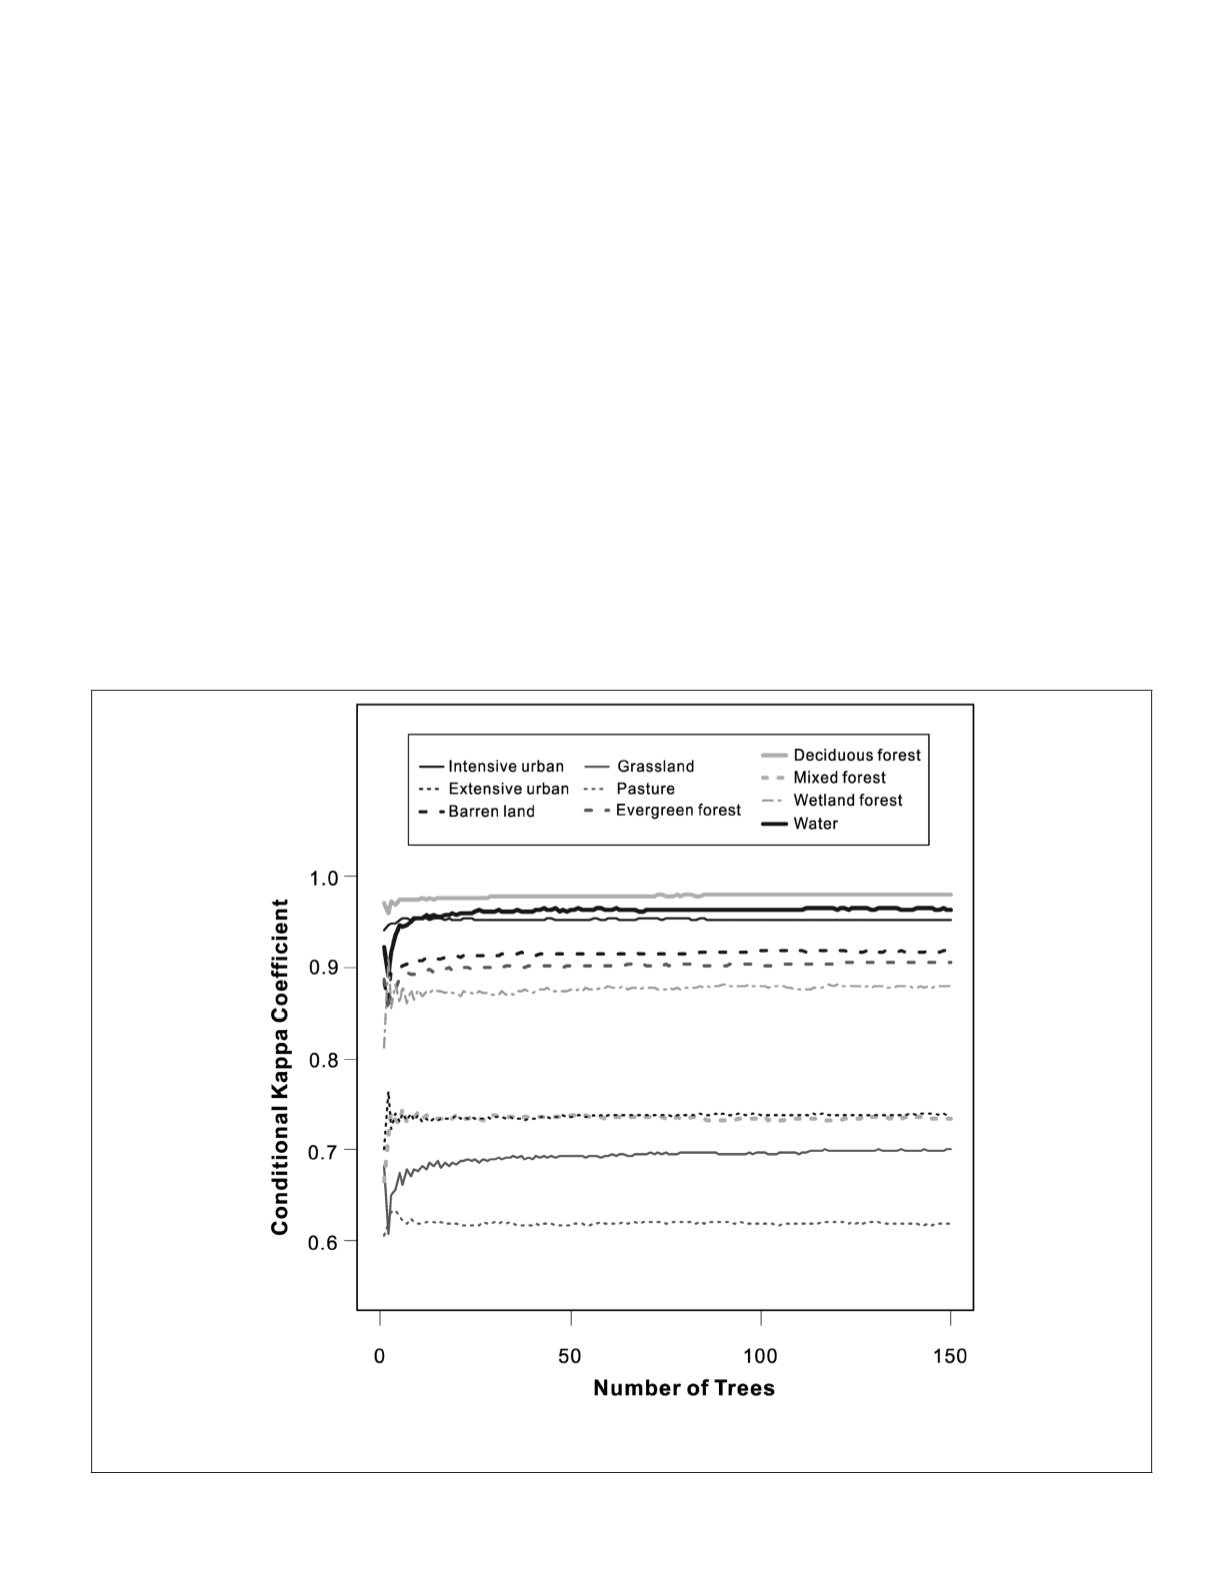
Figure 3. Thematic map accuracy for each land cover class in relation to the tree number. The conditional Kappa coefficient for each tree
number was used here, which was averaged for the feature number from one to seven with ten different random seeds. Note that the six
classes with relatively homogenous image characteristics tend to have higher map accuracies than the four relatively heterogeneous classes.
PHOTOGRAMMETRIC ENGINEERING & REMOTE SENSING
June 2016
413


