et al
., 2011; Rodríguez-Galiano
et al
., 2011; Ghimire
et al
.,
2012a, Maxwell
et al
., 2014 and 2015), and it has many at-
tributes that make it effective for image classification. It can
generally model complex interactions between predictor
variables, perform supervised and unsupervised classification
tasks, handle data with missing values, and provide high clas-
sification accuracies. It also generates measures of predictor
variable importance (Steele, 2000; Cutler
et al
., 2007).
Although
RF
is not commonly used for probabilistic map-
ping in the remote sensing community, it has been used as a
means to produce probability surfaces in other disciplines.
In an ecological modeling study, Evans and Cushman (2009)
used
RF
and climatic, topographic, and spectral predictor vari-
ables to predict the probabilities of occurrence of four conifer
species in northern Idaho, and found that probability surfaces
created a more useful and realistic model of the biotic com-
munities than traditional per-pixel classification.
RF
has also
been used for modeling resource development. For example,
Evans and Kiesecker (2014) and Strager
et al
. (2015) used the
algorithm to model the future development of Marcellus Shale
drilling and surface coal mining in Appalachia, respectively.
Study Area
The study site comprises the state of West Virginia, USA. The
state ranges in latitude from 37°N to 41°N and experiences a
humid continental climate with an average winter tempera-
ture of 1°C, and an average summer temperature of 22°C.
Rainfall varies from a high of 160 cm per year on the western
slopes within the highest elevations of the state, to 64 cm per
year in the drier, eastern panhandle. West Virginia land cover
is dominated by forests, with mixed mesophytic and oak for-
ests at lower elevations and northern evergreen and northern
hardwood forests occurring at elevations above approximately
760 meters (Strausbaugh and Core, 1997). The
NWI
data used
in this study indicates that approximately 1 percent of the
land area in the state is freshwater wetlands
.
The topography of the state is varied, though generally
rugged. The western portion of the state is characterized as a
mature plateau with moderate to strong relief, dissected by a
dendritic stream network. The highest elevations occur in the
center of the state, in the Allegheny Mountain section. The
eastern portion of the state, the Ridge and Valley province, is
characterized by linear ridges and valleys with a trellis stream
network (Strausbaugh and Core, 1997)
.
In order to investigate the importance of physiographic re-
gion in mapping the topographic probability of wetland occur-
rence, we made use of the ecological subregion classification de-
veloped by the United States Department of Agriculture (
USDA
)
Forest Service (McNab and Avers, 1994). This classification
divides West Virginia into 16 subregions based on geomorphol-
ogy, lithology and stratigraphy, natural vegetation, and climate.
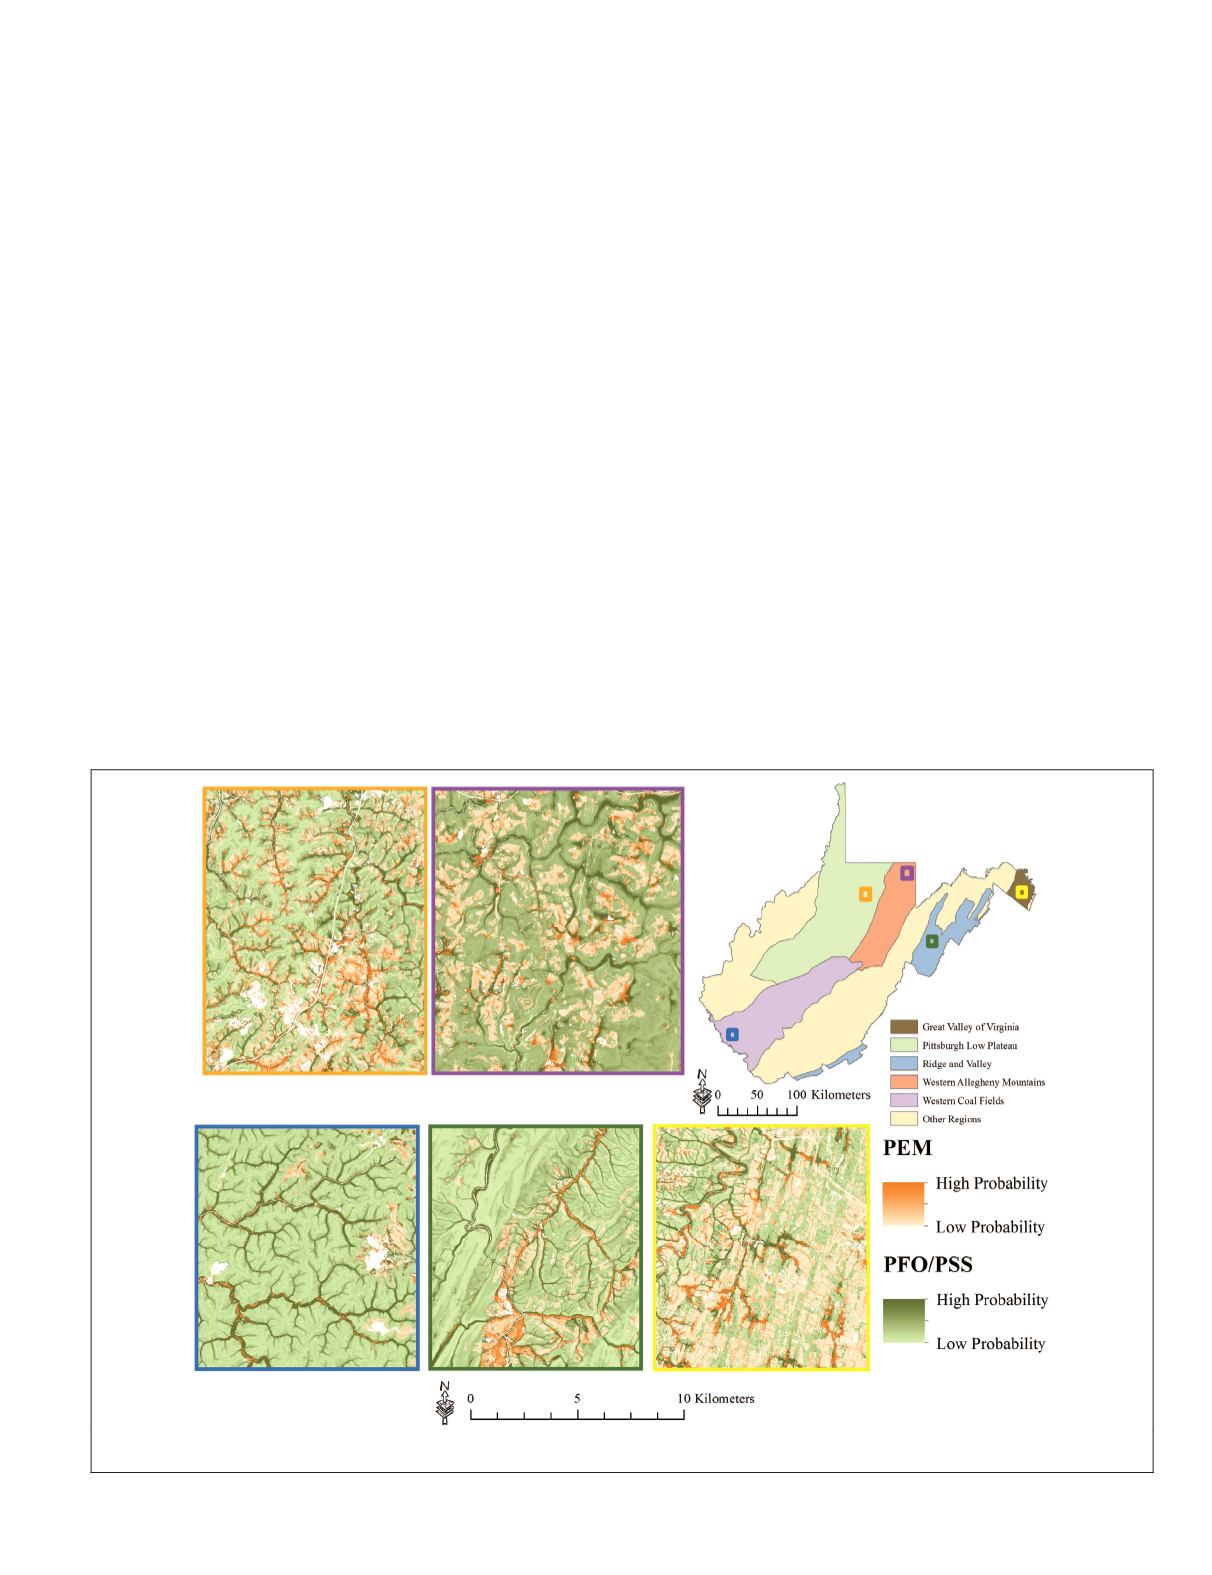
In this study, we compared models created for five of these
regions, which were chosen to represent the variety of land-
scape types in the state. The selected regions were: Great Valley
of Virginia, Pittsburgh Low Plateau, Ridge and Valley, Western
Allegheny Mountains, and Western Coal Fields (Plate 1).
Methods
Training Data and Validation Data
Training data were developed from an edited
NWI
dataset, cre-
ated by the Natural Resource Analysis Center (
NRAC
) at West
Virginia University (
WVU
).
NRAC
updated the
NWI
dataset
for
the entire state of West Virginia by overlaying the boundaries
Plate 1. Classification outputs as topographic probability of PEM and PFO/PSS wetland occurrence for ecological subregions analyzed
across the state of West Virginia.
PHOTOGRAMMETRIC ENGINEERING & REMOTE SENSING
June 2016
439


