0 1
Δ θ θ θ θ
= − −
(9)
P P R
1
= •∆
θ
(10)
If the characteristics of stratified Earth’s atmosphere and
the atmospheric refraction index are known, the refraction
deviation angle of each layer can be calculated by the iterative
calculation of Equations 3, 5, and 6. Thus, the atmospheric
refraction deviation angle
∆
θ
is calculated:
0 1
= −
Δ
θ θ θ θ
θ
− − −
j
(11)
where
j
is the number of layered atmosphere.
Atmospheric Refraction Index of Monochromatic Light
The imager of a high resolution optical satellite is often com-
posed of blue (0.45 - 0.52 μm), green (0.53 - 0.60 μm), red (0.63
- 0.69 μm), near-infrared (0.76 - 0.90 μm) multispectral bands
and 0.45 - 0.8 μm panchromatic band (Jacobsen, 2011; Yan
et al
.,
2013). When the monochromatic light passes through the Earth’s
atmosphere, the refraction index depends on its wavelength.
The shorter the wavelength is, the larger the atmospheric refrac-
tion index is. In the astronomical observation, Lipcanu (2005)
and Stone (1996) adopted the Owens (1967) atmospheric refrac-
tion calculation algorithm to analyze the impact of atmospheric
refraction on star observation. They found the atmospheric re-
fraction result in a 57.5 micro-radian error of a viewed star at 45
degrees zenith angle under the conditions of 15 Celsius degree
environment temperature and 760 mm Hg atmospheric pressure.
When the atmospheric temperature
t
(Celsius), the atmo-
spheric pressure
P
a
(Pascal) and the water vapor pressure
P
w
(Pascal) are known, the atmospheric refraction index is calcu-
lated according to the equations from 12 to 17:
n
D
S
−
(
)
× =
+
−
+
−
+
1 10 2371 34
683939 7
130
4547 3
38 9
8
2
2
.
.
.
.
σ
σ
6487 31 58 058 0 7115 0 08851
2
4
6
.
.
.
.
+
−
+
(
)
σ
σ
σ
D
W
(12)
where
D
P
T
T
S
S
=
+
× −
×
+
−
−
0 01 1 0 01 57 9 10
9 325 10 0 25844
8
4
2
.
.
.
.
.
P
T
S
(13)
D
P
P
T
W
W
W
=
+
+ ×
(
)
−
× +
−
−
−
0 01 1 0 01 1 3 7 10
2 37321 10
2 23366 710 79
6
3
.
.
.
.
.
. 2 7 75141 10
2
4
3
T
T
P
T
W
+
×
.
(14)
P P P
S a w
= −
(15)
T
t
=
+
273 15.
(16)
σ λ=
1
(17)
In the above equations,
P
S
(Pascal) is dry air pressure after
water vapor pressure removed,
T
is the absolute temperature
and
σ
is the wave number of monochromatic light with wave-
length
λ
micron.
Atmospheric Temperature (
t
)
The international standard atmosphere model (
ISO
2533: 1975)
is used to calculate the atmospheric temperature variation
with altitude. The
ISO
1975 atmosphere model defines that the
mean temperature at sea level is 15 Celsius degree, the atmo-
spheric pressure is 760 mm Hg and the Earth’s atmosphere is
divided into eight layers. The air temperature of each layer
linearly changes with altitude as the following formula:
t
h
h
h
=
−
−
− + −
− +
−
(
)
−
≤
15 6 5
56 5
56 5 20 063
44 5 2 8 32 162
2 5
0
.
.
.
(
.
)
.
.
.
.
km
h
h
h
≤
< ≤
< ≤
11 019
11 019
20 063
20 063
32 162
32 1
.
.
.
.
.
.
km
km
km
km
km
62
47 35
47 35
51 413
2 5 2 8 51 413 51
.
.
.
.
. (
.
)
.
km
km
km
km
< ≤
< ≤
− − −
h
h
h
413
71 802
58 25 2 71 802 71 802
86
.
.
(
.
)
.
km
km
km km
< ≤
− − −
< ≤
h
h
h
(18)
where
t
is the atmospheric temperature in Celsius degree.
However, the mean temperature at sea level varies with
geographic latitude, which makes the
ISO
1975 standard
atmosphere model to estimate temperature inaccurate in tro-
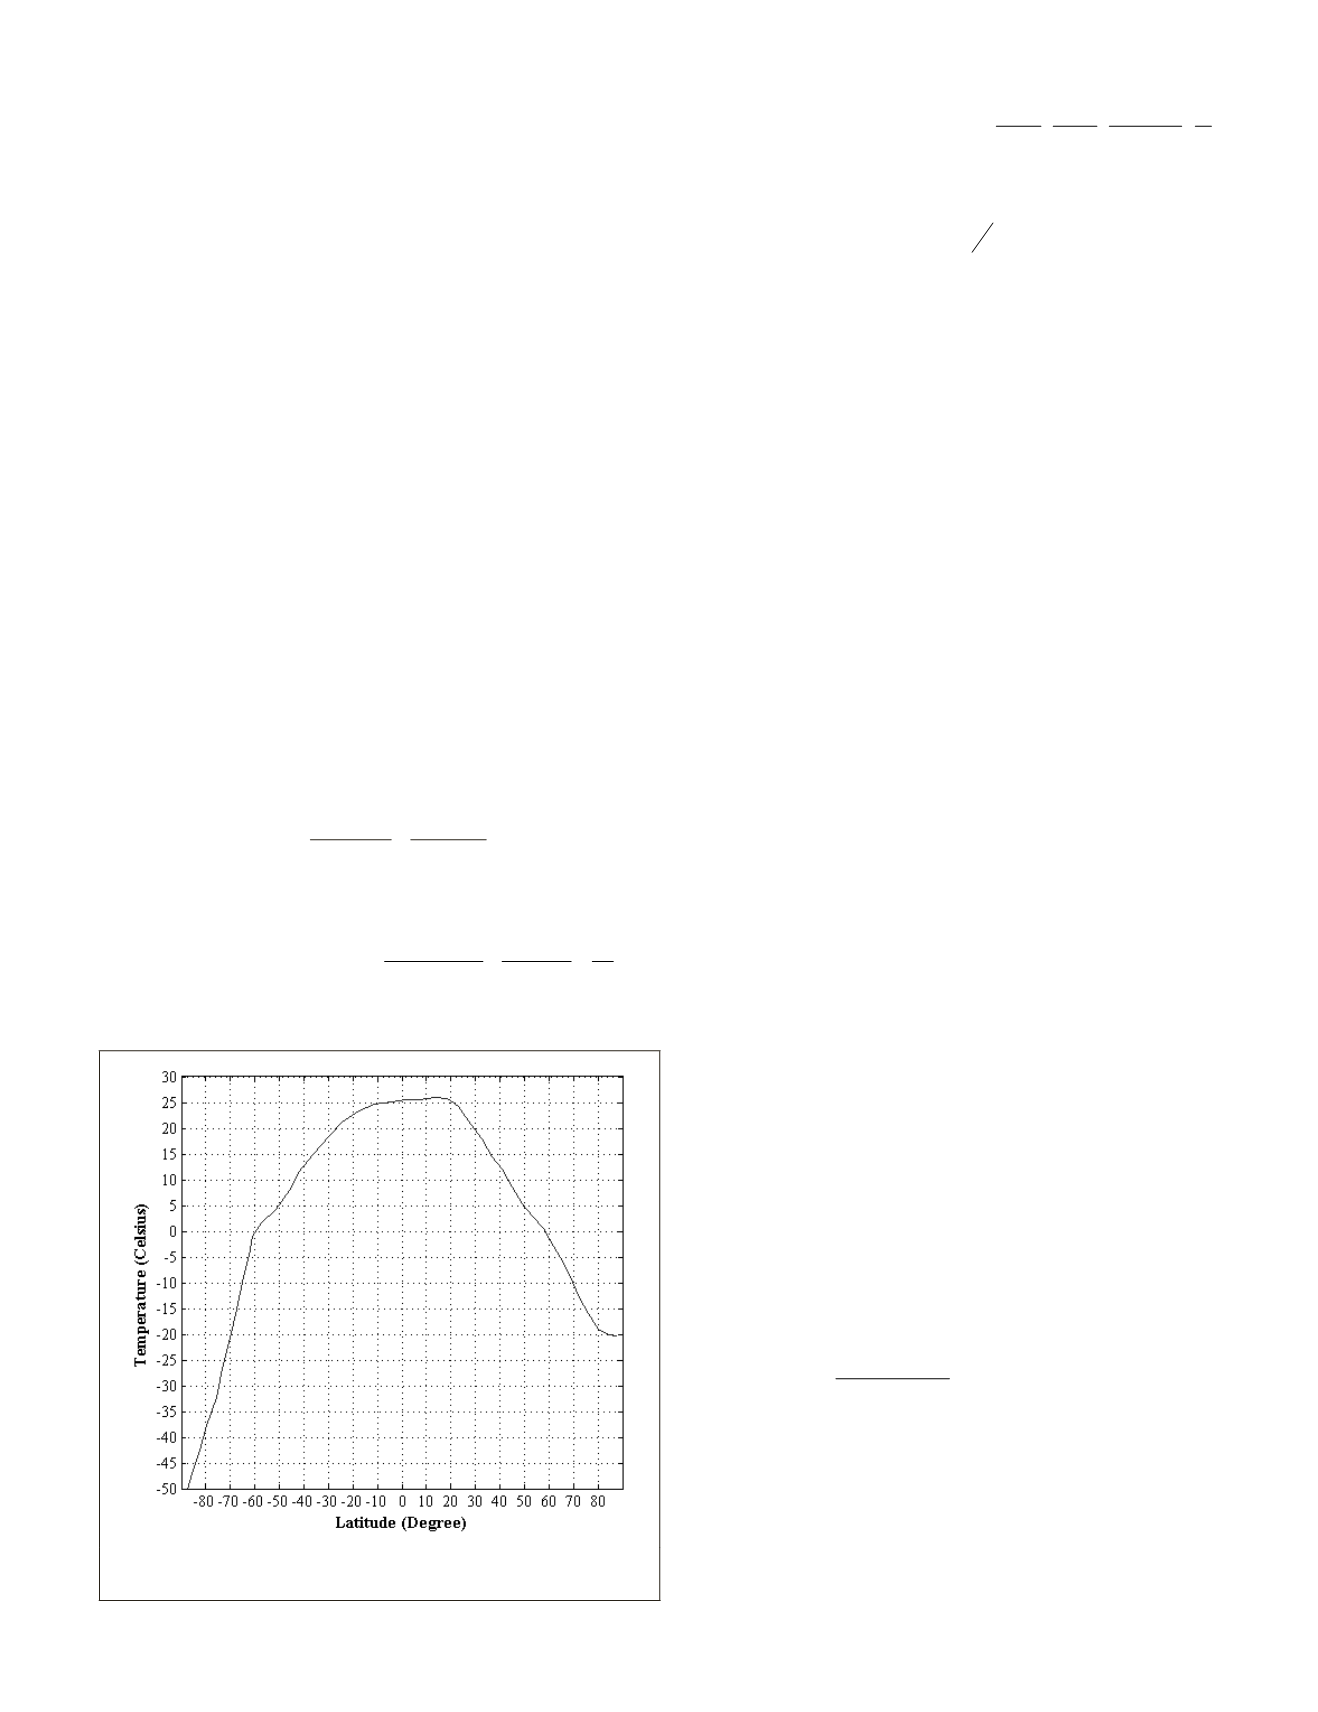
posphere. In the study of global precipitation with longitude
and latitude, Roper (2011) studied the earth surface mean air
temperature by averaging over all longitudes from 1948 to
2009, which is shown in Figure 2.
Some interesting conclusions can be drawn from Figure 2.
Let angle
φ
be the latitude degree, the cos(
φ
) can be regarded
as an independent variable linearly related to the Earth sur-
face mean air temperature in the northern hemisphere when
the latitude range is between 0 and 82 degrees. The same
conclusion holds true for the southern hemisphere as the fol-
lowing formula shows:
t
L
=
−
− ° ≤ ≤
−
< ≤ °
78 08
48 2 82
0
52 07
26 4 0 82
. cos
.
. cos
.
φ
φ
φ
φ
(19)
where
t
L
is the Earth’s surface mean air temperature. Here we
are only interested in air temperature in the troposphere of
Equation 18 which depends on the Earth surface air tempera-
ture
t
L
. Then, the troposphere air temperature at different
altitude becomes:
t t
t h
h
L
L
= +
− −
(
)
≤ ≤
56 5
11 019
0
11 019
.
.
.
.
km
km (20)
Atmospheric Pressure (
P
a
)
With the increase of altitude, atmospheric pressure smoothly
decreases following an exponential function (Portland State
Aerospace Society, 2004)):
Figure 2. Relationship between mean Earth surface air tempera-
ture with latitude.
PHOTOGRAMMETRIC ENGINEERING & REMOTE SENSING
June 2016
429


