P P
Lh
T
a
gM
R L
mol
= −
0
0
1
(21)
where
P
a
is the atmospheric pressure (Pascal);
P
0
is the atmospheric pressure at sea level (
P
0
= 101325 Pa);
g
is the earth surface gravity acceleration (
g
= 9.80665 m/s
2
);
M
is the molar mass of dry air (
M
= 0.0289644 kg/mol);
R
mol
is the gas constant (
R
mol
= 8.31447 J/(mol·K));
T
0
is the standard temperature at sea level (
T
0
= 288.15 K);
L
is the temperature lapse rate (such as:
L
= 0.0065 K/m in
troposphere).
The temperature of tropopause and stra-
topause is constant; atmospheric pres-
sure at any altitude in these two layers
is estimated according to the distance
from the point to the bottom of each
layer as the following equation:
P P exp
g
R T
h h
a
kg
=
−
−
1
0
1
(
) (22)
where
R
kg
is the gas constant (
R
kg
=
287.05287 J/(kg·k)),
h
1
is the distance
to the bottom of tropopause or strato-
pause and
P
1
(Pascal) is the atmospheric
pressure at the altitude of
h
1
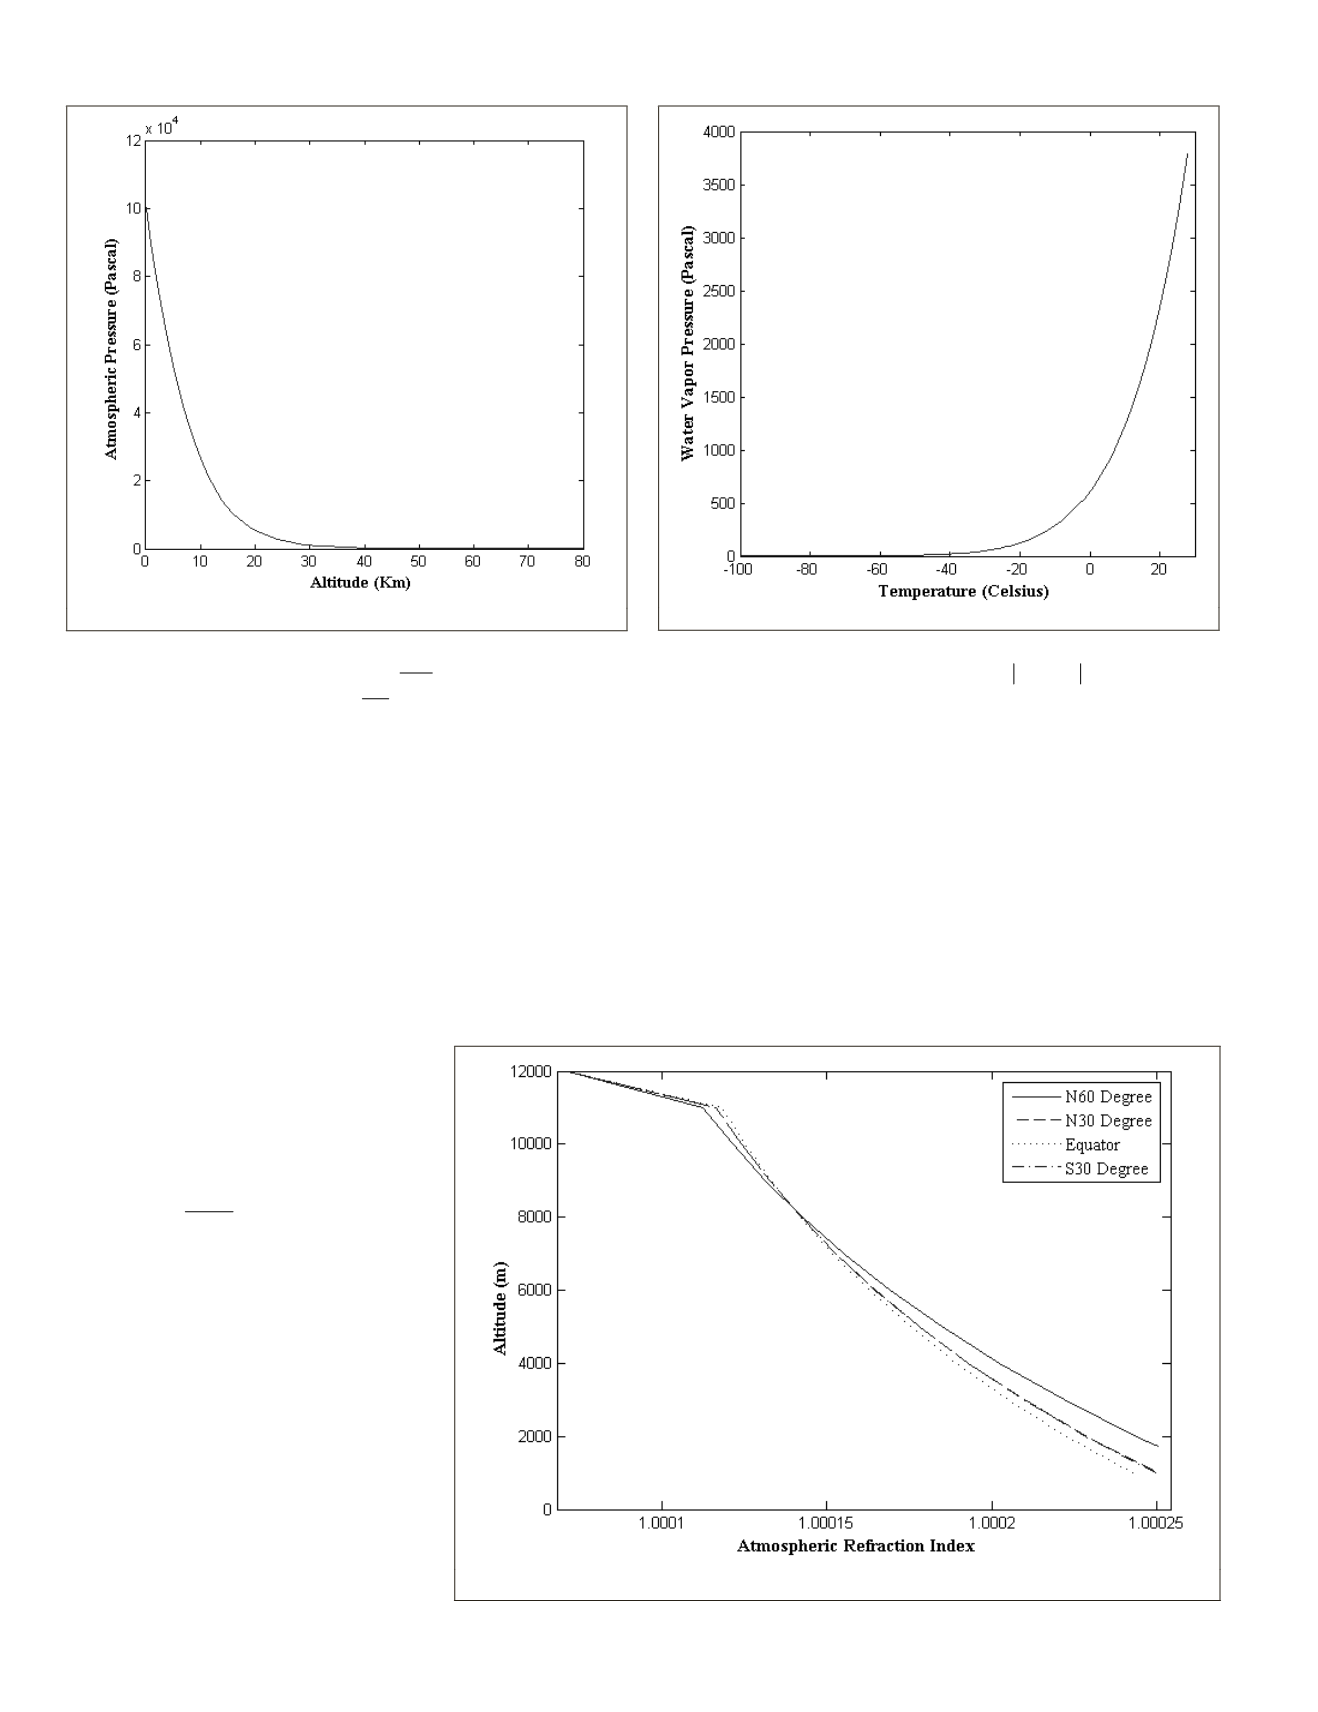
. Figure 3
shows how the atmospheric pressure
P
a
changes with the altitude.
Water Vapor Pressure
P
w
Water vapor pressure is only related
to the atmospheric temperature, and
the change with temperature can be
represented by the following equation
(Bosen, 1960):
P
t
t
w
≈
+
(
)
−
+ +
3386 39 0 00738 0 8072 0 000019 1 8 48 0 001316
8
.
.
.
.
.
.
(23)
where
P
w
is water vapor pressure (Pascal), and
t
is Celsius
degree.
Figure 4 illustrates how water vapor pressure changes from
the Earth’s surface air temperature 30 Celsius degrees to the
top mesosphere temperature −87 Celsius degrees.
Atmospheric Refraction Index (
n)
Suppose the atmospheric temperature is
t
, the air pressure is
P
a
, the water vapor pressure is
P
w
and the central wavelength
of spectral band is known, the atmospheric refraction index
in the stratified atmosphere can be calculated by using Equa-
tions 12 to 17. For the object points located on the Equator,
latitude 30° and 60° in the northern hemisphere, and 30° in
the southern hemisphere, Figure 5 shows the atmospheric
Figure 3. Atmospheric pressure changes with altitude.
Figure 4. Water vapor pressure changes with temperature.
Figure 5. Atmospheric refraction indexes change with altitude in the troposphere.
430
June 2016
PHOTOGRAMMETRIC ENGINEERING & REMOTE SENSING


