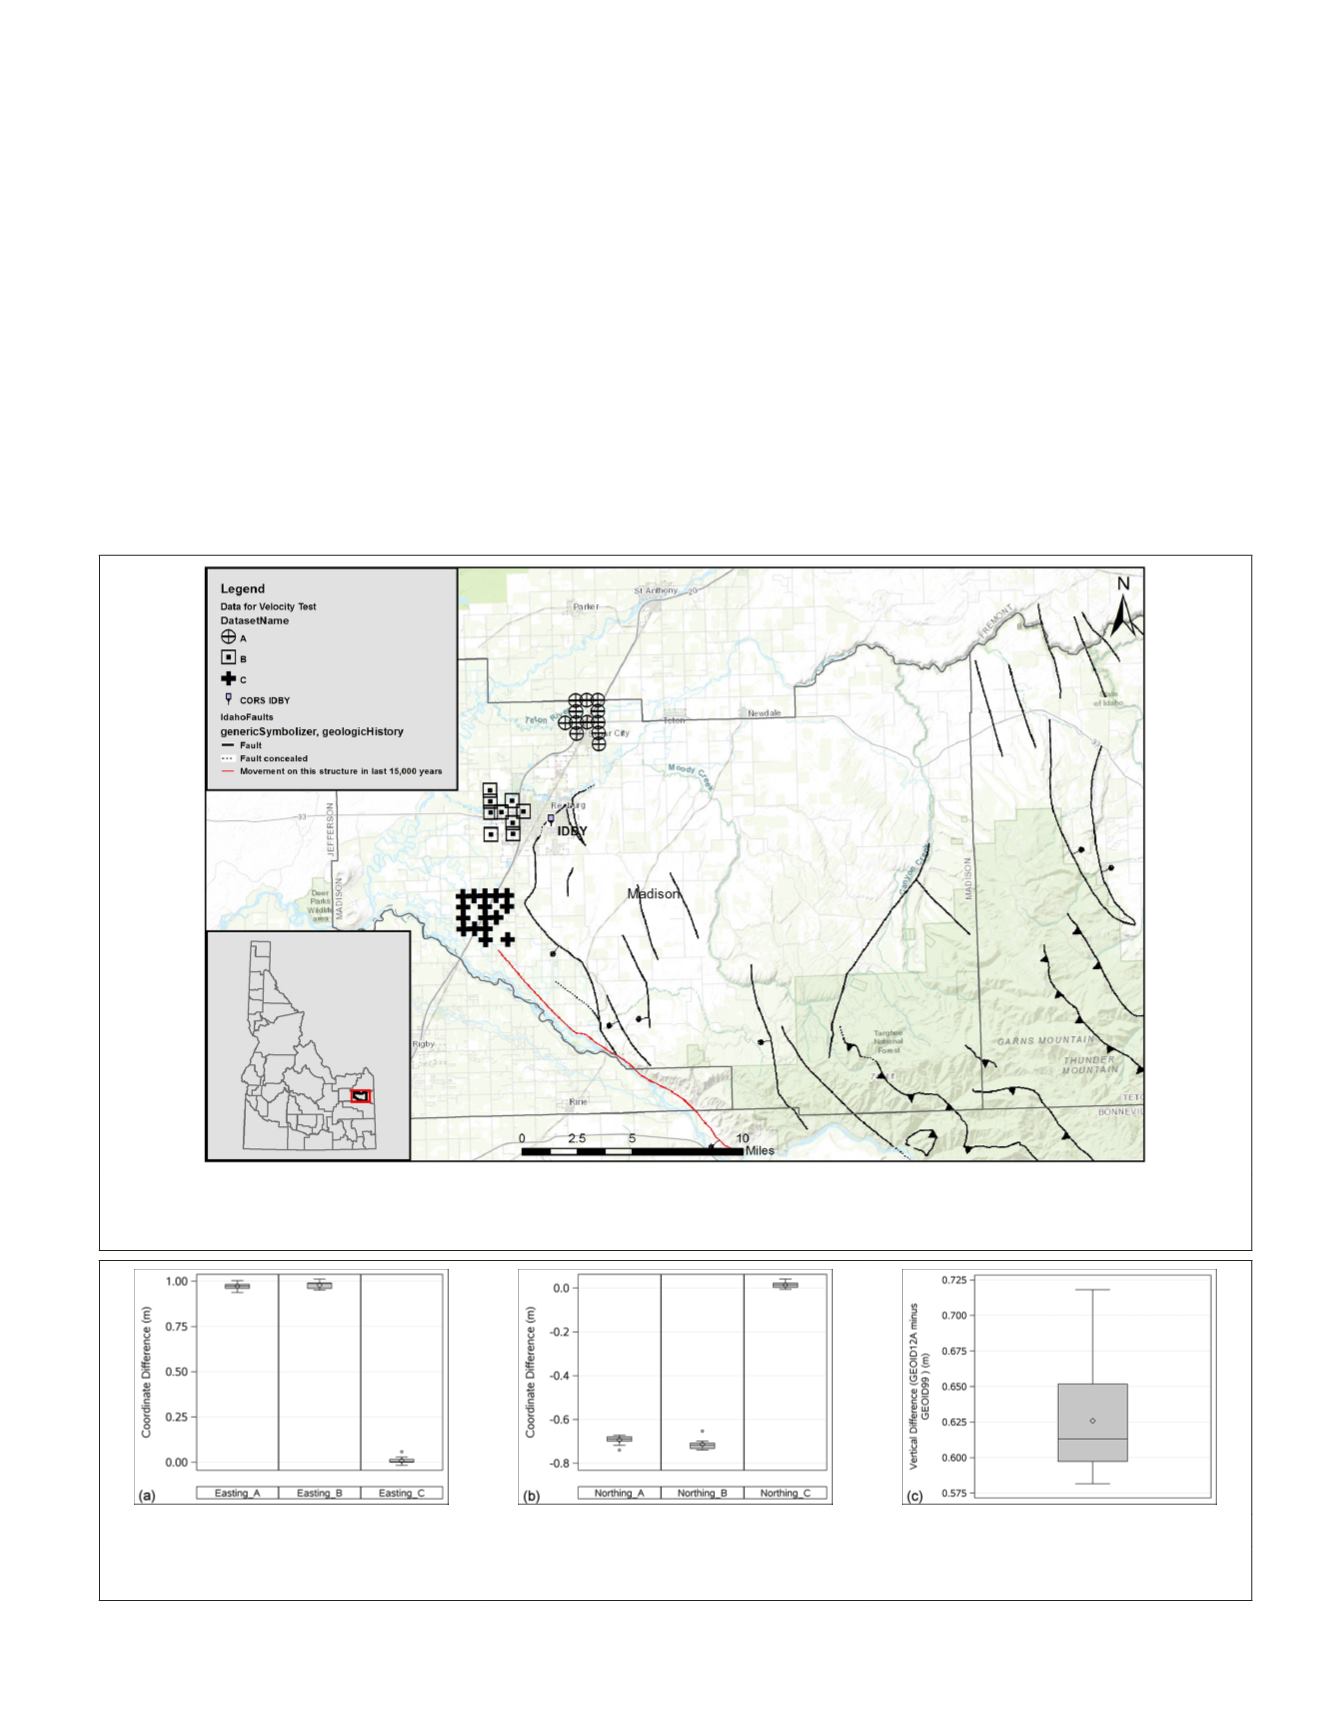
Figure 13. Datasets (‘A’ circle, ‘B’ square, and ‘C’ cross) for velocity comparisons near
IDBY
CORS
site. Faults (triangles indicate
thrust fault; solid circles indicate downthrown block) are shown in solid black lines, and recent movement along red line
(Source of Faults: Inside Idaho).
(a)
(b)
(c)
Figure 14. Boxplots of, (a) easting, and (b) northing differences (in meters) in
NAD 83
(2011) minus
NAD
83(
CORS96
) for datasets
‘A’, ‘B’, and ‘C’; and (c) vertical difference (in meters) for
GEOID12A
minus
GEOID99
.
years are about 80 cm which is larger than the
NGS
predicted
coordinate change at
IDBY
of 30 mm over eight years (Figure
12a). Dataset ‘C’ shows a smaller change of about 2 cm over
eight years in a northeast direction. This suggests data col-
lections are strongly influenced by local tectonic factors that
may not be captured by a single
CORS
. In addition, all three
datasets (A, B, and C) were collected between 2012 and 2016,
and the multiyear
NGS
velocity map (Figure 12) was based
on data up to 2010. This indicates this area might be experi-
encing further movement since 2010. We examined the long
term time series plot found at
NGS
CORS
website for
IDBY
(
CORS
IDBY
,
NGS
), but the plot has data only from 2007 to 2011. No
information could be extracted that could have been used to
correlate with the collection time of the three datasets used
in this study. Since the change in dataset C was small,
IDBY
and dataset C might represent movement of the same geologic
setting, and datasets A and B may represent movement of
another local geologic setting. Existence of numerous active
faults (Figure 13) in the area supports this idea. Geologically,
this area is located near the Intermountain Seismic Belt, a
prominent NS-trending zone of seismicity and a region of
moderate-to-high seismic hazard (Sbar
et al
., 1972; USGS,
Earthquake Hazards Program).
The analysis of vertical velocity changes compared
orthometric heights derived from
GEOID99
and
GEOID12A
(el-
lipsoid heights obtained from
NAD
83(2011) were used in
the construction of
GEOID12A
and ellipsoid heights from
NAD
83(
CORS96
) used
GEOID99
). The comparison of vertical data in-
dicates higher values in
GEOID12A
(Figure 14c) corresponding
with an upward velocity in the area (Figure 12b).
Discussion
The stability analysis of monument settings on a large set of
data consisting of 82 control points presents a new approach
to recognizing differences in the coordinates of control points.
Although it might be intuitive to check physical sites in
person, the approach taken in this paper is a convenient way
PHOTOGRAMMETRIC ENGINEERING & REMOTE SENSING
April 2018
223


