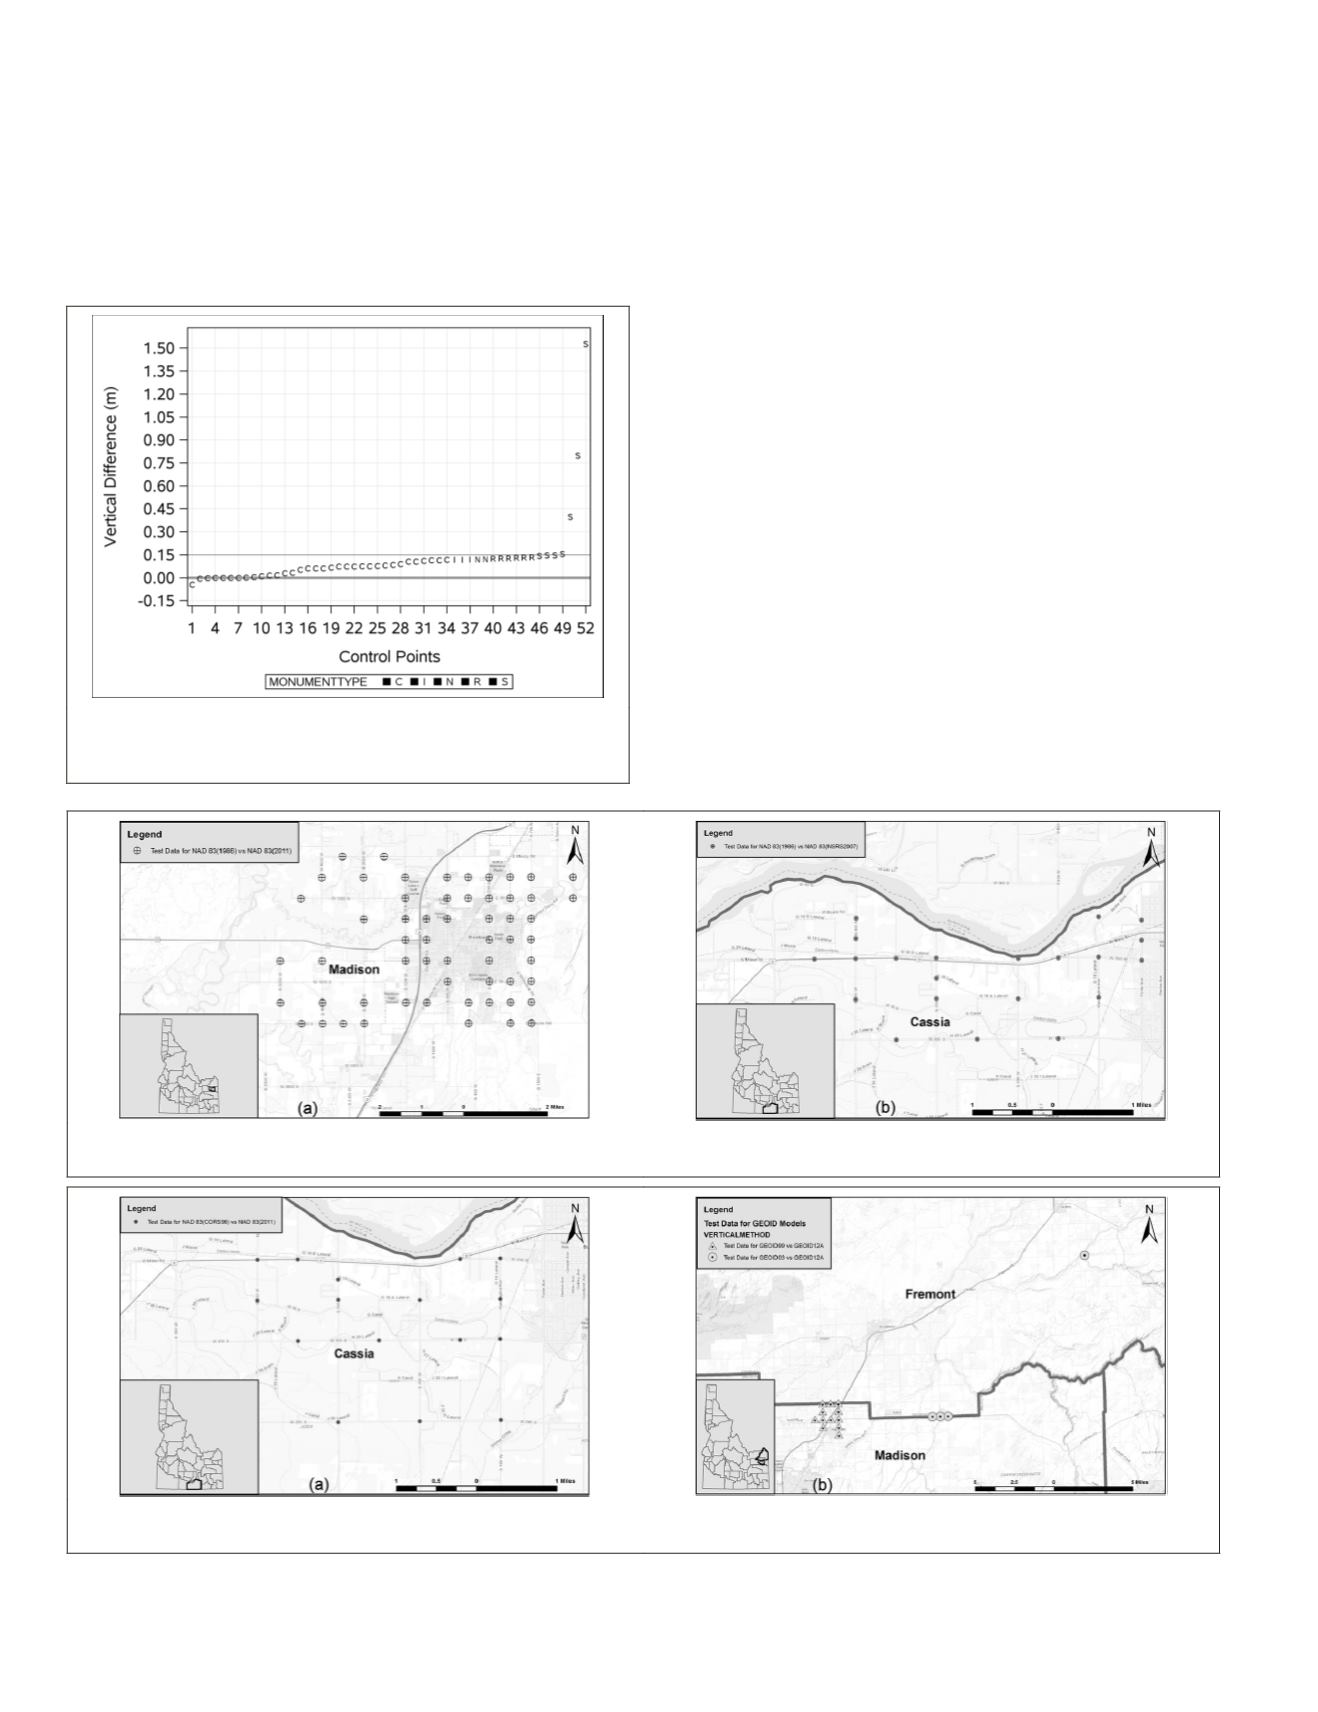
between 2013 and 2015 observations was 12 cm which is ap-
proximately a 3
σ
error. After removing the values of the three
possible outliers, the mean value of elevation differences
was reduced to 7 cm which is likely a more representative
result. Since vertical error in observations is always higher
than horizontal error, and is dependent upon the type of
GPS
technique used, it can be safely concluded from the low esti-
mate of mean differences between 2013 and 2015, that there
is no indication of disturbance in the physical setting for the
observed control points. However, the three outliers war-
rant physical inspection and possible resetting of the survey
marks.
Analysis of the Changes with Datum Realizations
Three datasets were selected for this analysis. These datasets
contained control point coordinates observed in different
realizations of
NAD 83
for the same control point. Datasets were
also chosen to study changes due to differing geoid models
used to derive the vertical coordinates for the same control
point. The three combinations of horizontal datum realizations
and two combinations of geoid models found in the
MCPD
database (Figures 6 and 7) were statistically analyzed (Table 1).
NAD 83(1986) versus NAD 83(2011)
The test for this comparison used 85 control points located in
Madison County, Idaho (Figure 6a). These control points were
acquired by two different surveyors in 1997 and again in 2015
using
NAD 83
(1986) and
NAD 83
(2011), respectively. Frequency
histograms are shown in Figure 8. Neither easting nor north-
ing differences were zero-centered: for easting and northing,
the means were −0.98 m and 0.68 m with standard deviations
of 0.021 m and 0.011 m, respectively. Values of
t
-tests for the
differences (428.65 for easting and 551.55 for northing) were
far greater than the critical
t
-value (1.99) indicating a signifi-
cant difference between easting and northing values obtained
in
NAD
83(1986) versus
NAD 83
(2011). The total horizontal
Cartesian differences were computed and resulting ranges
varied from 1.14 m to 1.25 m, with 99 percent of values
found between 1.20 m to 1.25 m (
p
<0.0001). The mean value
of the total horizontal difference was 1.20 m (Figure 8). It is
Figure 5. Vertical difference (2013 minus 2015) derived
from
GEOID03
plotted by the types of monument setting,
cement (c), iron (i), nail (n), rebar (r), and stone (s).
Figure 6. Datasets for: (a)
NAD 83
(1986) versus
NAD 83
(2011) in Madison County, and (b)
NAD 83
(1986) versus
NAD 83
(
NSRS2007
)
in Cassia County, Idaho.
Figure 7. Datasets for: (a)
NAD
83(
CORS96
) versus
NAD 83
(2011) in Cassia County, and (b)
GEOID99
versus
GEOID12A
in Madison
County and
GEOID03
versus
GEOID12A
in Fremont County, Idaho.
220
April 2018
PHOTOGRAMMETRIC ENGINEERING & REMOTE SENSING


