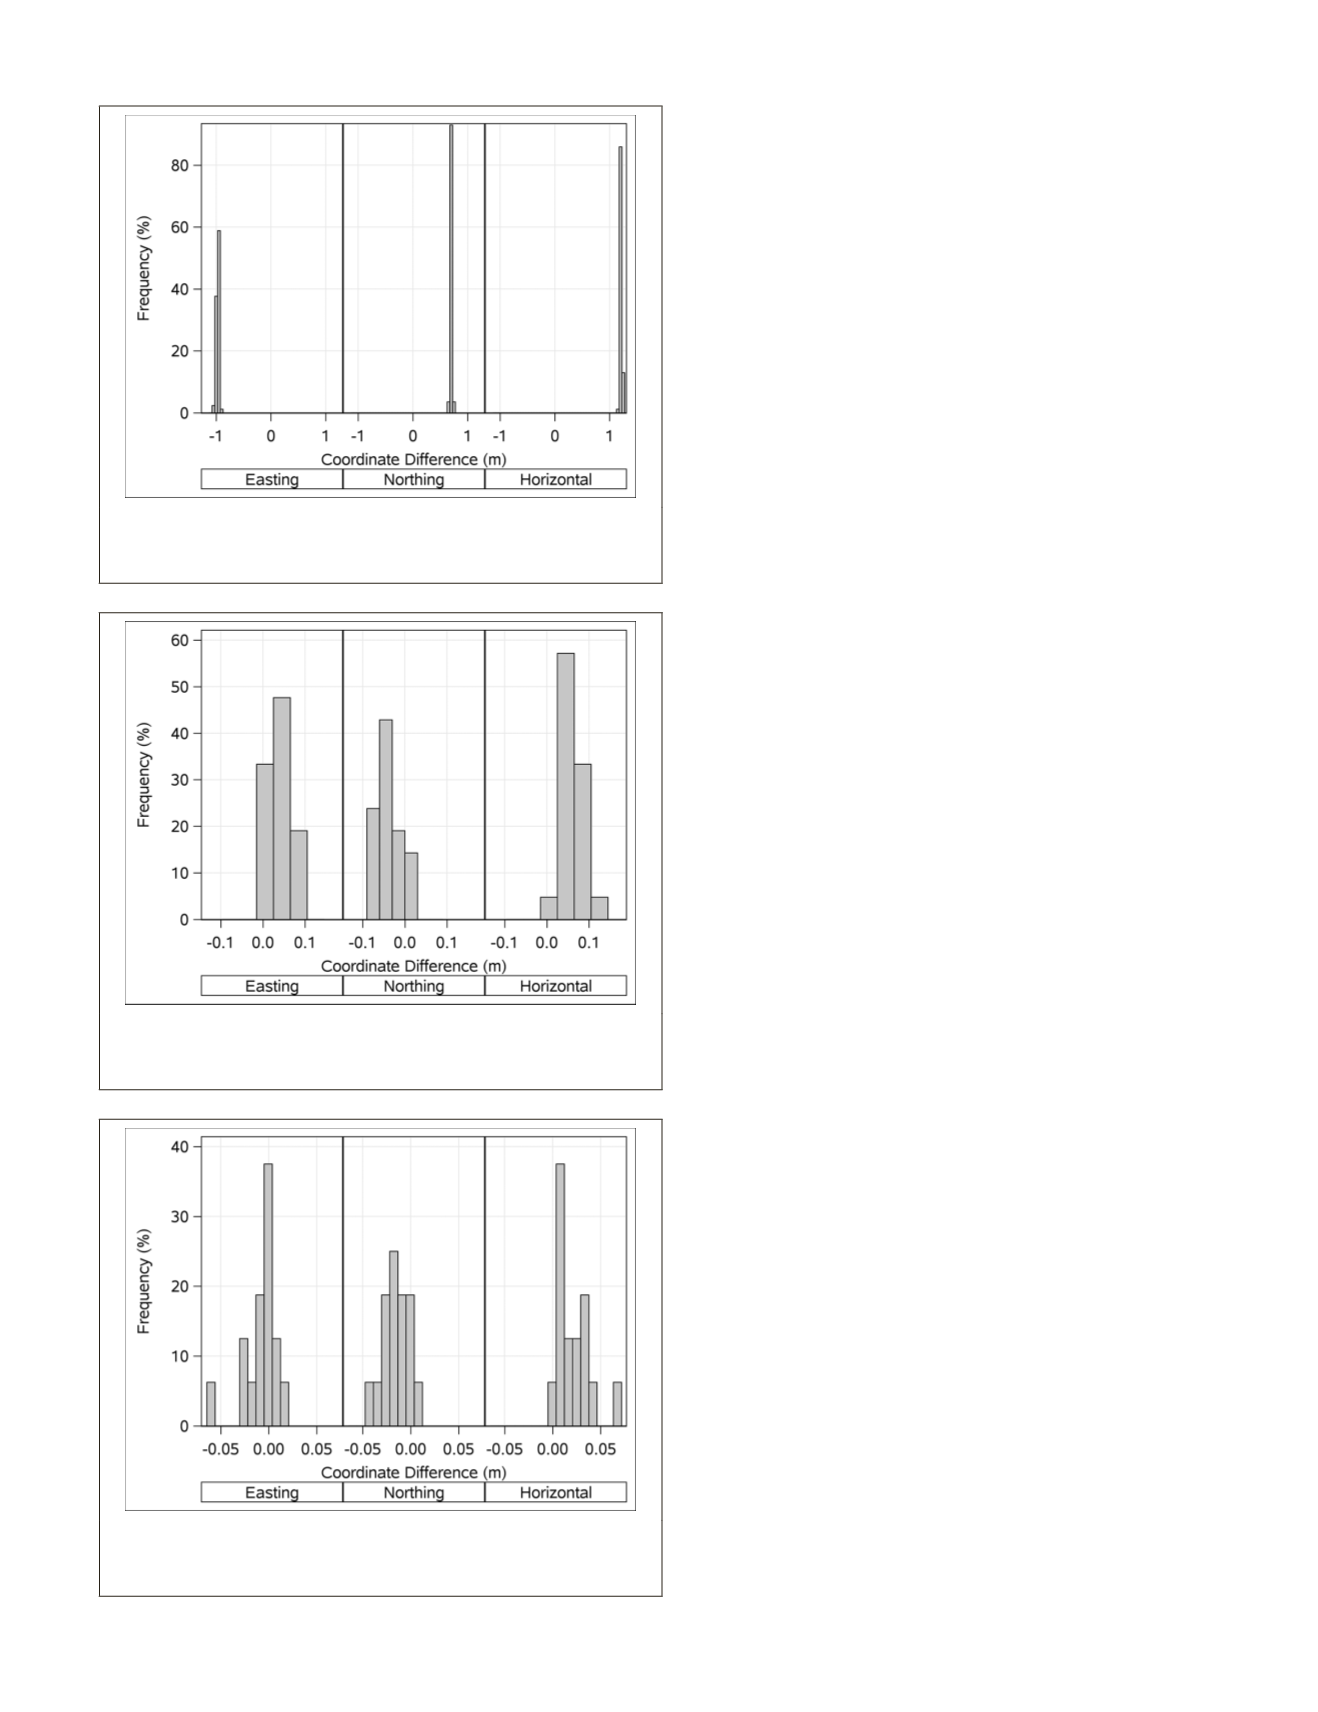
apparent that
NAD
83(1986) and
NAD 83
(2011) vary greatly in
coordinate values.
NAD 83(1986) versus NAD 83(NSRS2007)
A dataset with 21 control points was used to compare
NAD
83
(1986) and
NAD 83
(
NSRS2007
) coordinate values (Figure 6b).
These control points were observed by two different survey-
ors in 2015 using two different realizations (
NAD 83
(1986)
and
NAD 83
(
NSRS2007
)). The difference in easting and northing
values in both observations were statistically analyzed with
minimum differences found to be -0.01 m and -0.09 m, re-
spectively. The maximum observed differences in easting and
in northing were 0.09 m and 0.02 m, respectively.
A
t
-test for each easting and northing difference was per-
formed and in both tests, the observed
t-
values (6.43 and 5.74)
were greater than the critical
t
-values (2.09) indicating both
easting and northing values were different when obtained in
NAD 83
(1986) versus
NAD 83
(
NSRS2007
). Mean values for the dif-
ference in easting and northing were 0.04 m and −0.04 m, and
the standard deviations were 0.027 m and 0.030 m in easting
and northing, respectively. The mean value in total horizontal
Cartesian difference was 0.06 m (p <0.001) and the maximum
value was 0.11 m (Figure 9).
NAD 83(CORS96) versus NAD 83(2011)
This dataset contained 16 control points located in Cassia
County, Idaho (Figure 7a). Two surveyors observed the same
control points using
NAD 83
(
CORS96
) in 2012 and
NAD 83
(2011)
in 2015. To understand differences in easting, northing, and
total horizontal Cartesian distance between these two realiza-
tions, these data were explored and statistically analyzed as
described above. Frequency histograms are shown in Figure
10. The means for easting and northing differences were 0.009
m and 0.014 m with standard deviations of 0.011 m and 0.021
m, respectively. Only 18 percent of values were zero-centered
for northing differences, whereas 37 percent of values were
zero-centered for easting differences. The results of
t
-test
show northings were different at the 0.05 significance level
while eastings were different at the 0.10 significance level.
The mean difference in northing values (0.014 m) ex-
ceeded that found for easting values (0.09 m). The maximum
horizontal Cartesian difference was 0.071 m and the resulting
t
-test indicated the two dataset were significantly different
(p <0.001). Hence there is a difference in horizontal values
obtained in
NAD 83
(
CORS96
) relative to the values obtained in
NAD 83
(2011).
GEOID99 versus GEOID12A and GEOID03 versus GEOID12A
A small testable dataset containing only 12 control points
was found in Madison County, Idaho. Vertical coordinates
(orthometric height) for these control points were observed
using two different geoid models,
GEOID99
and
GEOID12A
.
Another small dataset of 8 control points was found in Fre-
mont County, Idaho with vertical coordinates observed using
GEOID03
and
GEOID12A
(Figure 7b). Heights derived from both
GEOID99
and
GEOID03
were subtracted from heights derived
from
GEOID12A
. Frequency histograms are given in Figure 11.
The mean difference was 0.62 m in the case of
GEOID99
versus
GEOID12A
, whereas the mean difference was −0.30 m in the
case of
GEOID03
versus
GEOID12A
. The visible contrast (some
were positive and some showed negative differences) in the
differences between
GEOID03
versus
GEOID12A
(Figure 11) indi-
cates higher values tend to be acquired from
GEOID12A
at some
control points relative to
GEOID03
. Upon further investigation,
it was observed that control points with higher values (from
GEOID12A
) were located further northeast than the other con-
trol points (Figure 7b), and a possible upliftment of that area
may be a factor explaining this observation. An
NGS
-derived
velocity map explains this further (Figure 12b).
Figure 8. Histogram plots for the difference (m) in easting,
northing, and total horizontal Cartesian differences between
NAD 83
(1986) and
NAD 83
(2011).
Figure 9. Histogram plots for the differences (m) in easting,
northing, and total horizontal Cartesian differences between
NAD 83
(1986) and
NAD
83(
NSRS2007
).
Figure 10. Histogram plots for differences (in meters) in
northing and easting, and total horizontal Cartesian distance
between
NAD 83
(
CORS96
) and
NAD
83(2011).
PHOTOGRAMMETRIC ENGINEERING & REMOTE SENSING
April 2018
221


