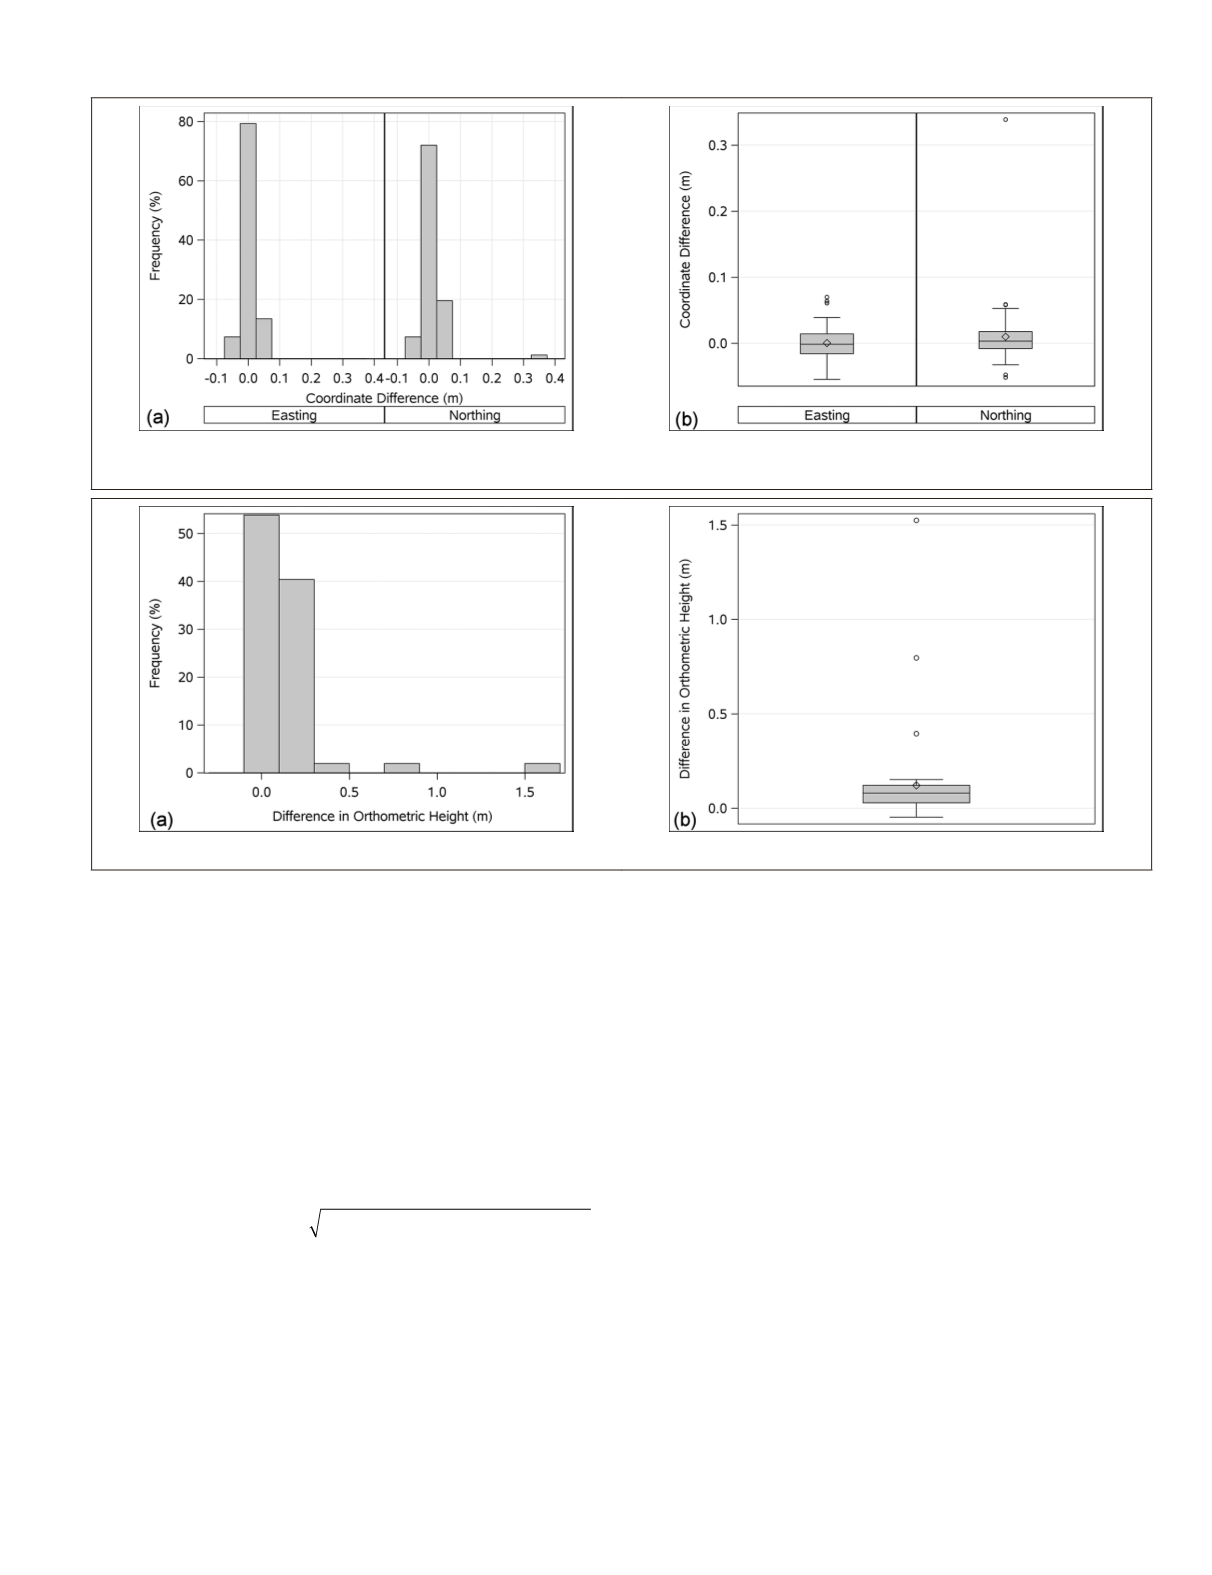
confirmed there was no significant difference between east-
ings measured in 2013 and 2015.
Northing data did not follow a normal distribution so a
nonparametric sign test was performed to determine whether
there exists any significant difference in northings derived
in 2013 and 2015 observations. The computed
Z
= 2.30, was
greater than 1.96 (the critical
Z
-value at 0.05 significance
level). Hence the null hypothesis is rejected. However, if the
confidence level were increased to 99 percent, the critical
Z
-value becomes 2.57 which is just slightly greater than the
computed Z-value (2.30), and in this case one would con-
clude no significant difference at 0.01 significance level.
Total horizontal Cartesian differences were computed using
the Pythagorean Formula (Diff_Northing) (Diff_Easting)
2
2
+
.
A
t
-test was performed on the total Cartesian horizontal differ-
ence, and the
t
-statistic was found lower than
t
-critical value
(
p
= 0.93 for a two-sided comparison). It is confirmed there
is no statistical difference in horizontal coordinates between
2013 and 2015 observations. Therefore, the authors conclude
there was no change in the physical environment of these
monuments. However, the outlier point noted earlier with an
extreme northing difference remains to be verified in the field,
and possible elimination of erroneous data from the database.
Analysis of Vertical Coordinates
Using the same dataset described above, vertical coordinates
of 52 control points were measured using the
GEOID03
model
in 2013 and again in 2015 (by different surveyors). The sta-
tistical significance of differences in measured data between
2013 and 2015 were analyzed. The histogram plot (Figure 4a)
shows approximately 53 percent of measured heights have
zero difference whereas about 40 percent data exhibit approx-
imately 20 cm differences (mean was 12 cm). Three probable
outliers are revealed in the boxplot analysis (Figure 4b).
A nonparametric sign test was performed to determine any
significant difference in elevation derived between 2013 and
2015 observations. The computed Z-value was 5.57 which is
greater than the critical Z-value of 1.96 at 0.05 significance
level. Hence, it can be concluded elevations measured in
2013 and 2015 are not same.
Monument stability may be a factor causing the varia-
tion in elevation, so the observed differences were plotted
by monument type (Figure 5), where C, I, N, R, and S denote
monuments made of cement, iron, nail, rebar, and stone
respectively. Monuments made of cement post lie close to the
zero mean difference, whereas monuments made of stone are
the farthest from zero mean difference. Three stone control
points indicate extreme differences in elevation and may
indicate possible subsidence of those monuments.
The 2
σ
measurement errors in elevation for both 2013 and
2015 observations were 9 cm. However, the mean difference
Figure 3. (a) Histograms, and (b) boxplots of the differences in easting and northing (in meters) between 2013 and 2015
control point observations using
NAD
83(1986).
Figure 4: (a) Histogram, and (b) box plot for the difference in elevation (in meters) (2013 minus 2015) derived from
GEOID03
.
PHOTOGRAMMETRIC ENGINEERING & REMOTE SENSING
April 2018
219


