A
t
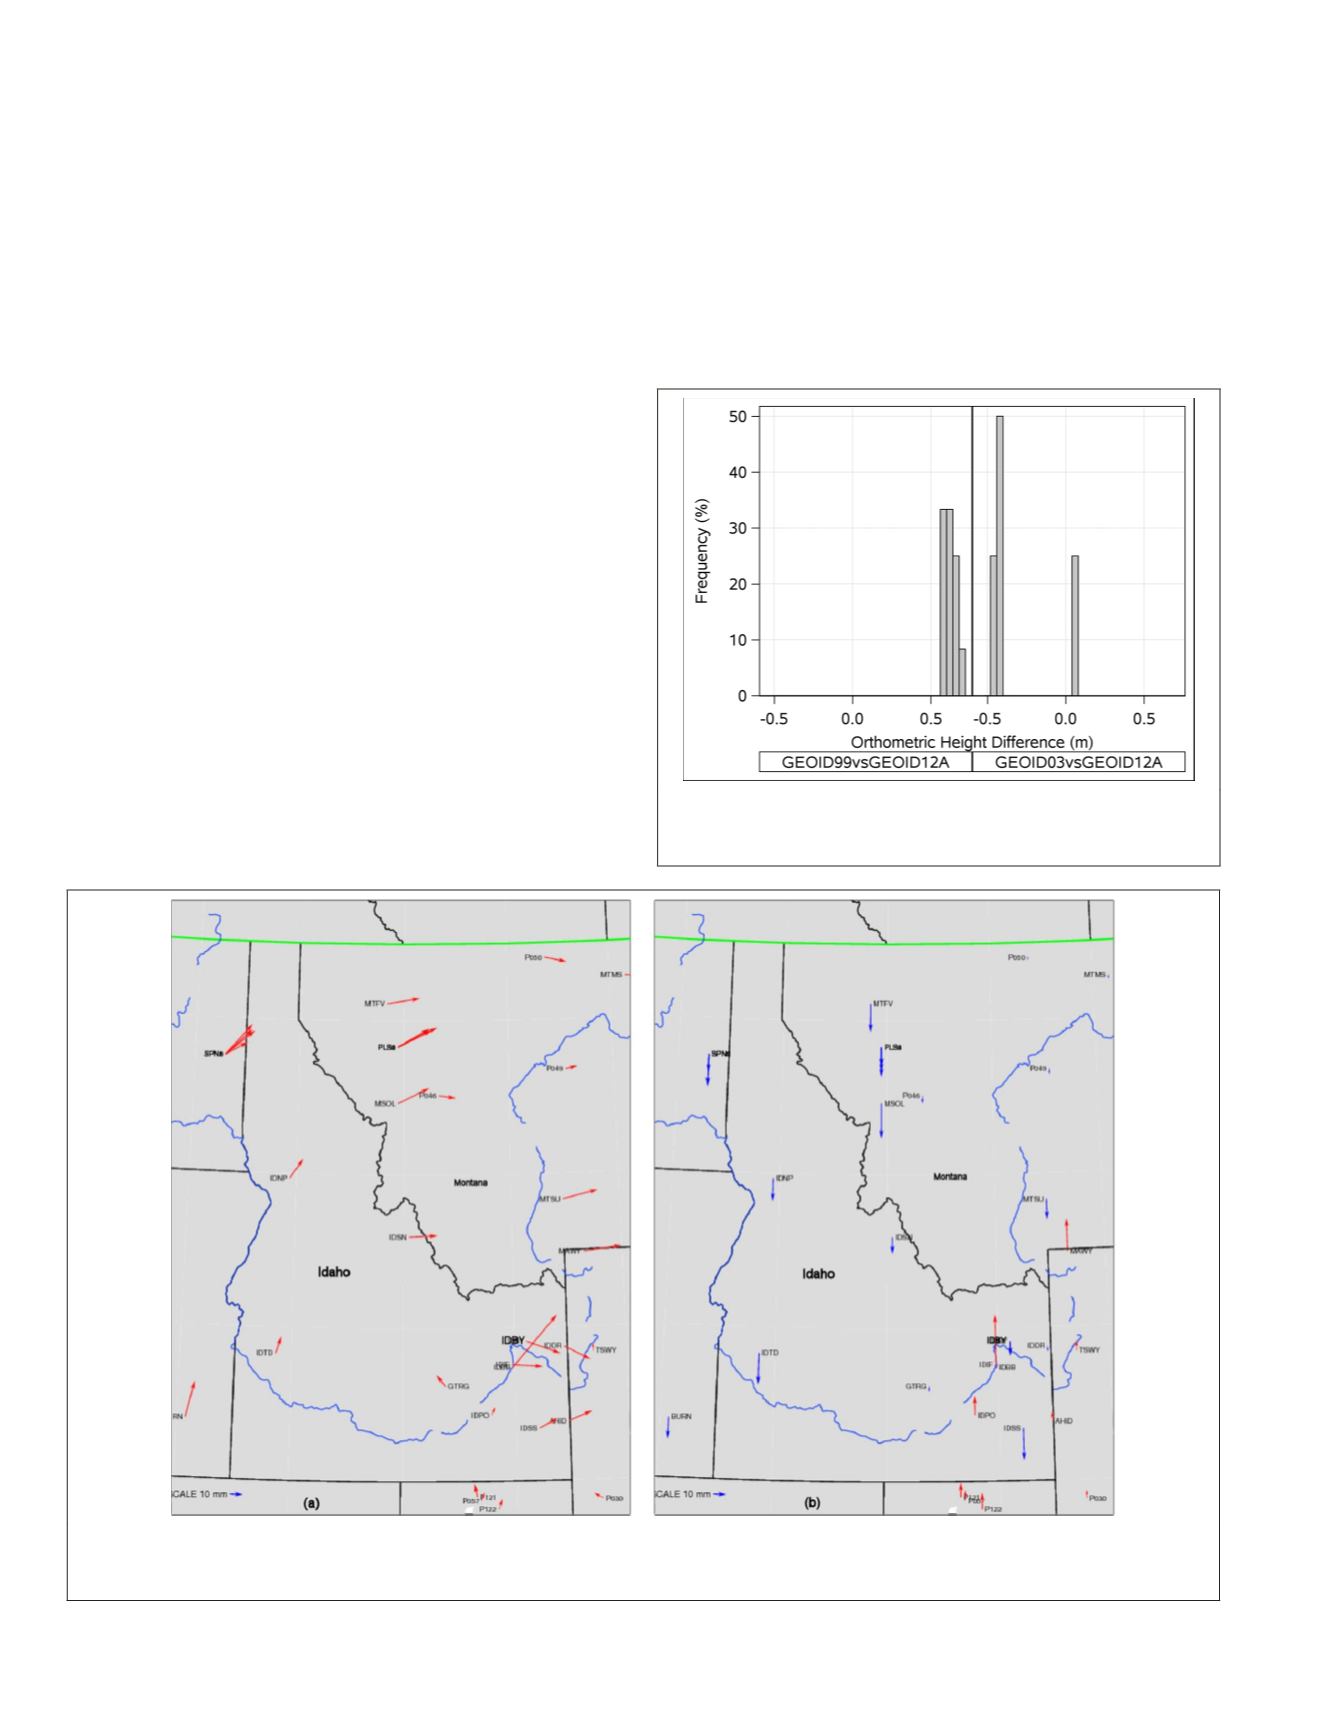
-test for each dataset showed the observed
t
-statistics
were greater (54.73 and 3.63) than the critical
t
-values (2.20
and 2.37) at 0.05 significance for both
GEOID99
versus
GEOI-
D12A
, and
GEOID03
versus
GEOID12A
, respectively. The differ-
ence between
GEOID03
and
GEOID12A
was smaller than
GEOID99
and
GEOID12A
. The maximum and minimum differences were
0.72 m and 0.58 m between
GEOID99
and
GEOID12A
, and −0.45
m and 0.08 m between
GEOID03
and
GEOID12A
.
Analysis of Change in Coordinates due to Velocity
NAD 83
(2011) epoch 2010.0 incorporates regional velocity, and
coordinate analyses in
NAD 83
(2011) epoch 2010.0 versus
NAD
83(
CORS96
) epoch 2002.0 indicate scale of changes over eight
years from epoch 2002.0 to epoch 2010.0. A velocity map for
Idaho produced by
NGS
shows the velocities and direction of
these movements of the
CORS
(Figure 12).
It is apparent when examining the magnitude as indi-
cated by the arrows in Figure 12 that east Idaho experiences
a higher magnitude of velocity relative to southwest Idaho.
Correspondingly, the arrow at
CORS
site
IDBY
in east Idaho sug-
gests a total horizontal displacement of about 30 mm (com-
paring the given magnitude of 10 mm scale) over eight years
in a southeast direction (Figure 12a). Three datasets close
to the
IDBY
CORS
in Madison County, Idaho (Figure 13) were
analyzed to determine if velocity differences were consistent
between
CORS
sites and nearby control points. Circle-shaped
points indicate dataset ‘A’ (located between 7 to 9 km north
of
IDBY
), square-shaped points indicate dataset ‘B’ (located
between 2 to 4 km west of
IDBY
), and cross-shaped points
indicate dataset ‘C’ (located between 6 to 9 km south of
IDBY
).
Datasets were observed in
NAD 83
(2011) and
NAD 83
(
CORS96
),
with survey periods for dataset ‘A’ in September 2016 and
December 2012, dataset ‘B’ in October 2015 and December
2012, and dataset ‘C’ in October 2015 and December 2012, re-
spectively.
RTK
was used as a data collection technique for all
these datasets. Dataset ‘A’ consisted of 12 control points, ‘B’
consisted of 9, while ‘C’ consisted of 16 control points. These
control points were chosen to analyze coordinate change with
respect to changes in crustal velocity.
Boxplots of easting and northing differences for all three
datasets obtained from
NAD 83
(2011) epoch 2010.0 minus
NAD
83(
CORS96
) epoch 2002.0 are shown in Figure 14(a) and 14(b).
Both datasets ‘A’ and ‘B’ represent positive easting and nega-
tive northing differences which indicate these two datasets
have moved in southeast direction. It is imperative to note
that datasets ‘A’ and ‘B’ mimic the movement of
IDBY
in a
southeast direction, however their rates of changes over eight
Figure 11. Histogram plots for the differences in orthometric
heights (in meters) for
GEOID99
versus
GEOID12A
and
GEOID03
versus
GEOID12A
.
Figure 12. Velocity vectors of
CORS
in Idaho: (a) horizontal vectors are shown as red arrows, (b) upward vertical as red and
downward vertical as blue arrows (and river marked blue); derived from
NAD
83(2011) epoch 2010.0 minus
NAD
83(
CORS96
)
epoch 2002.0 (Source:
CORS
Myear,
NGS
).
222
April 2018
PHOTOGRAMMETRIC ENGINEERING & REMOTE SENSING


