Additionally, if the landscape pattern is more heteroge-
neous, the
OC
was reduced much more when the base map
was upscaled. For example, Table 2 shows that the
ASD
4580
is the most homogenous of all the study areas, and
ASD
1830
is the most heterogeneous area. The
OC
in
ASD
4580 was
reduced about 1.89 percent (Figure 3f) and about 8.69 percent
in
ASD
1830 (Figure 3c). These results demonstrate that the
degree of heterogeneity impacts the performance of
FMC
.
Additionally, considering the results discussed above, we
recommend that
FMC
should be employed to conduct the up-
scaling, despite that it is impacted by the landscape pattern.
Since both
FMC
and
MRB
are equally influenced by landscape
pattern, the advantages of
FMC
make it the approach of choice
when upscaling.
Influence of Class Proportion on FMC
Several researches (e.g., Raj
et al
., 2013) reported that
MRB
increased the proportion of dominant classes and decreased
the proportion of non-dominant classes. In this paper, non-
crop is the dominant class, and others are the non-dominant
classes. Our analysis of
MRB
shows consistent results with
these previous studies. Since the
CMP
is calculated from
MRB
,
it is necessary to detect whether the class proportion has an
influence on
FMC
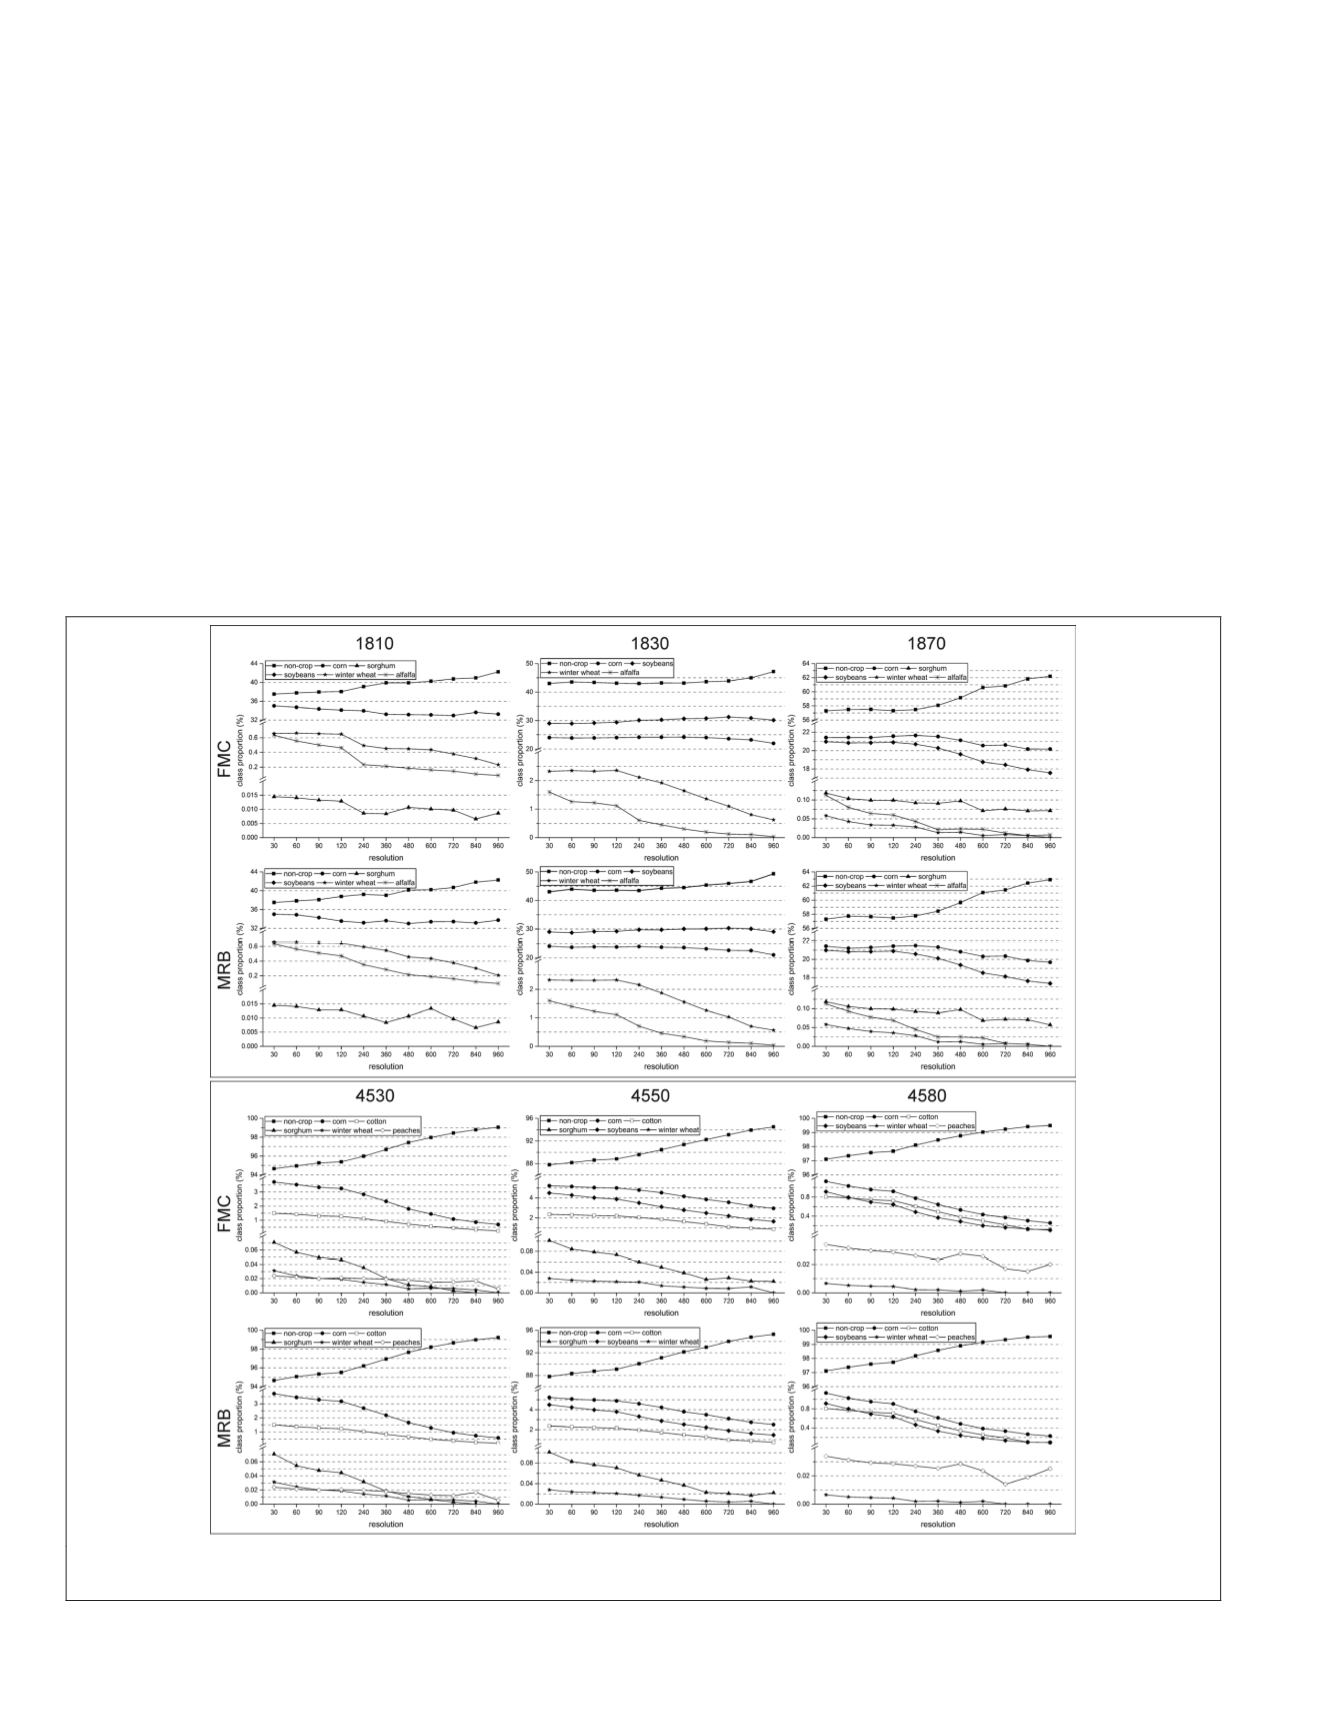
’s performance. Additionally,
FMC
shows that
the proportion of the dominant class increased when imple-
menting upscaling, while the proportion of non-dominant
class decreased (Figure 8).
Figure 8 showed that
FMC
reduced the influence of class
proportion on upscaling to some degree. For example, in
ASD
1830, the proportion of the dominant class (i.e., non-
crop) increased about 6.33 percent when implementing
MRB
,
while only about 4.13 percent when implementing
FMC
. The
proportion of corn (non-dominant class) was reduced about
3.05 percent when implementing
MRB
in
ASD
1830, while only
about 2.03 percent when implementing
FMC
. These results
demonstrate that
FMC
can mitigate the impact of proportion
of one class on the proportion of this class in the upscaled,
coarser map.
Influence of Exponent Values on FMC
As illustrated in the Methodology Section, the exponent val-
ues determine the importance of the information (i.e.,
CLP
and
CMP
) to calculate the fused probabilities for determination of
the map class type of the output coarse-pixels. To assess the
effects of the exponent values on the upscaled maps produced
by
FMC
, thirteen pairs of exponent values for
τ
CLP
=0, 0.01,
Figure 8. Proportion of each class in coarse maps produced by FMC and MRB. The upper panel is for relatively heterogeneous
study areas. The lower panel is for relatively homogeneous study areas.
96
February 2018
PHOTOGRAMMETRIC ENGINEERING & REMOTE SENSING


