of a 3D model, the initial point cloud from multiple images
was registered with a more refined laser scanning result using
an
ICP
method. Jensen
et al
. recently published a data set con-
taining 80 scenes for large scale multi-view stereo evaluation
using a similar approach but with a structured light (Jensen
et
al
., 2014). For outdoor scenes, Strecha
et al
. proposed a meth-
od that can combine multiple lidar scans with images based
on physical markers placed on a test scene (Strecha
et al
.,
2008). Later, Geiger
et al
. proposed more automated method
which combines lidar and two video cameras with accurate
localization systems (e.g.,
GPS
and
IMU
) to cover a wider area
from a long-distance drive (39.2 km) (Geiger
et al
., 2012).
Good quality of reference data for an outdoor scene is pos-
sible by registering active sensors to stereo cameras as men-
tioned above, and in fact it is widely used in the orbital sensor
calibration process in many remote sensing applications. For
example, the performance of the
SIMBIO-SYS
imagining suite
employed in
ESA
BepoColombo mission was assessed during
a pre-flight calibration process, where laser scans of a small
target object are used to validate a stereo reconstruction result
of the sensor (Simioni
et al
., 2014). Also, the high-resolution
stereo camera (
HRSC
) on Mars Express was validated based
on various outdoor scenes captured during on-ground and
airborne test (Jaumann
et al
., 2007). However, this approach is
not always available, especially, when performing planetary
3D reconstruction using robotic vision systems. Also, creating
reference data using multiple sensors would be a very expen-
sive process in terms of computation complexity and labor,
even though a new set of test data is frequently required to
evaluate advanced algorithms. To address this, we introduce
a new accuracy evaluation method to assess stereo matching
results when there is no prior knowledge about the depth
of points within a scene. This “ground truth” independent
evaluation criteria were inspired by the use of manual mea-
surements in stereo photogrammetry, originally performed
using film media and optic mechanical instrumentation, but
since the early 2000s using so-called softcopy stereo worksta-
tions based on stereoscopic displays. An early example of the
use of these manual photogrammetric measurements using an
analytical stereoplotter is discussed by Day and Muller, 1989.
A recent paper also showed that the use of 3D stereoscopic
display can improve human performance in locating objects
and inferring depths of surfaces within a scene (Mcintire,
2014), so that this approach is not only more effective than
the manual point selection used by the computer vision com-
munity in early days (Nakamura
et al
., 1996), but also closely
related to the local cross-correlation process inspired by a
biological vision system (Fleet
et al
., 1996).
In this work, a Java-based stereo workstation has been de-
veloped based on work performed at
JPL
on being able to dis-
play stereo data on different stereo displays (Pariser and Deen,
2009). We trained a group of research participants to make
repeat measurements of the three-dimensional position of
fixed points in the same scenes using a stereo cursor on a ste-
reo workstation display (Azari
et al
., 2009; Shin
et al
., 2011).
A stereo display is afforded either using anaglyptic fusion of
stereo-pairs on a color display or by using different specialist
stereo display devices (Figure 1a and 1b) of increasing sophis-
tication and cost. These tie-points are then used to compute
error metrics of different stereo matching algorithms by com-
paring the computed disparity map with the corresponding
manual measurements under three different manual selection
scenarios. A 2D Gaussian function based scoring metrics have
also been introduced for a quantitative evaluation.
The proposed evaluation method can be used to comple-
ment the Middlebury test when we need new test images
from more complex scene at higher image resolution. More
importantly, it can complement the missing evaluation work
of stereo matching of rover imagery from planetary robotic
missions, such as the
NASA
Mars Exploration Rover (
MER
) or
Mars Science Laboratory (MSL), where obviously we do not
have either any “ground truth” 3D data nor any prior knowl-
edge of the scene.
This evaluation method was proposed within the EU FP-7
Planetary Robotics Vision Ground Processing (PRoVisG: EU
FP-7 PRoVisG project;
/
), and has been ap-
plied to evaluate the accuracy of disparity maps computed
from stereo pairs in the PRoVisG Mars 3D challenge cam-
paign
/
) as well as additional
stereo-pairs captured in the ExoMars Pancam test campaign at
Clarach Bay in Aberystwyth (ExoMars test campaign:
https://
, using state-of-art
planetary stereo technologies from
NASA
-
JPL
(USA), Joanneum
Research Institute (Austria) and
UCL
-
MSSL
(UK).
We explain more details of the proposed evaluation proto-
col in the following section. Based on which, we present the
evaluation results of a couple of disparity maps produced by
JPL
,
JR
, and
UCL
followed by our discussion.
Method
Stereo Workstation
Most stereo matching algorithms used in the remote sensing
community employ an automated workflow that has been
built based on different mathematical definitions of image fea-
tures (e.g., corners and edges) and/or matching (dis-)similarity
of corresponding points on a stereo pair. However, this often
neglects the impact of different detection errors from various
imaging conditions such as image noise, viewing angle, reso-
lution, and scale difference. In addition, there is normally no
proper visual validation of the detected point pairs.
To address these issues, we developed a Stereo WorkSta-
tion (StereoWS) under the PRoVisG project. The proposed
system is capable of visualizing tie-points on a stereo pair in
a hardware-independent manner, e.g., with a conventional
color display, it will automatically switch the rendering mode
to stereo anaglyphs (See Figure 2a).
We also developed intuitive user interfaces to facilitate the
tie-point validation and selection process. For example, pro-
vided there is no pre-existing disparity map, users can make
measurements using a floating 3D cursor, or fix the cursor in
the left image at a pre-defined point and only allow the right
image cursor to move in 3D (i.e., by changing the disparity of
the stereo cursor) in order to be able to place the 3D cursor
onto a visually perceived surface. When there is an initial
disparity map available, however, the offset of the stereo cur-
sor will be automatically adjusted to speed up the tie-point
selection process.
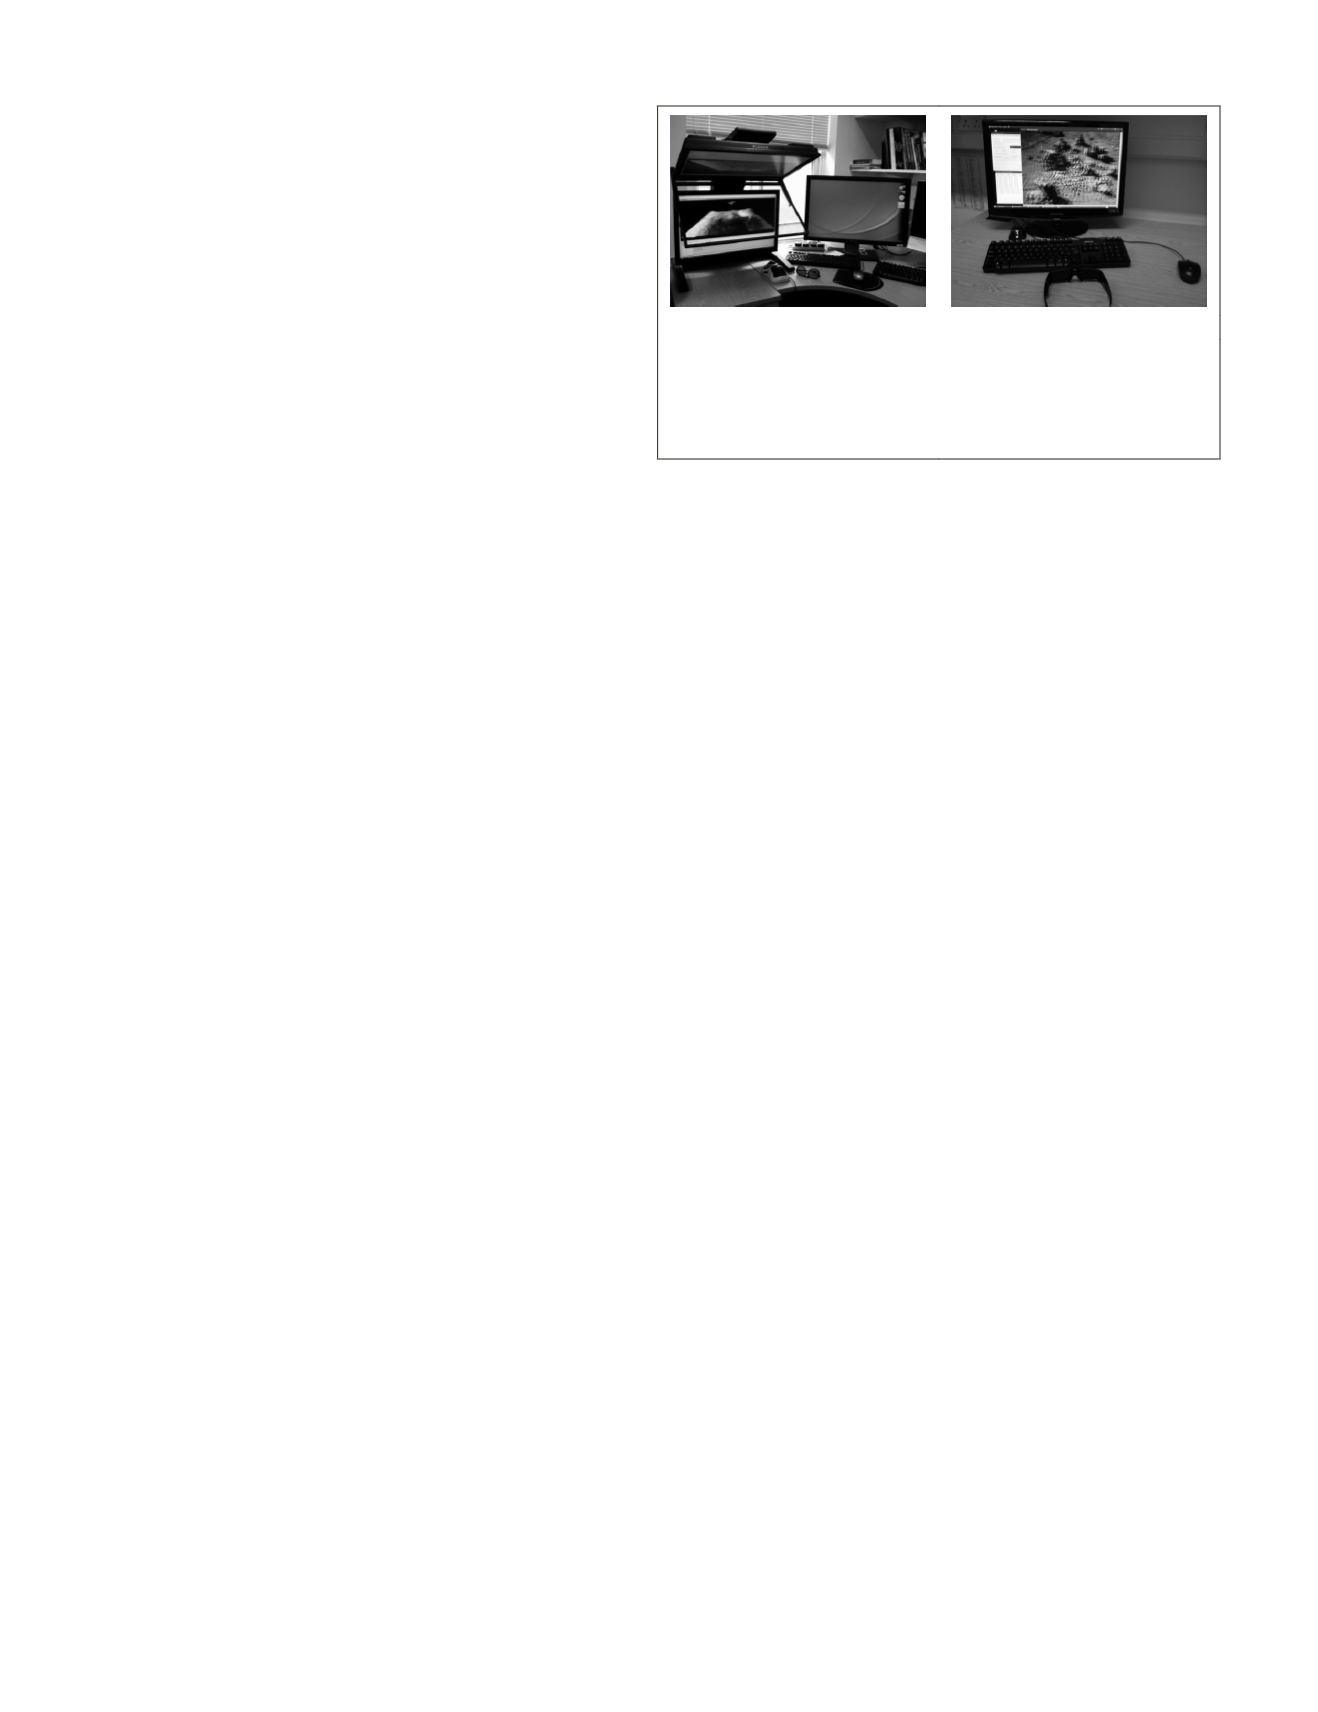
(a)
(b)
Figure 1. Example of stereoscopic visualisation: (a) a passive
stereo display where images from upper and lower displays
are reflected on a polarised beamspliter in the middle; and
(b) an active stereo display uses a high refreshing
LCD
screen
(120
HZ
) with synchronised
NVIDA
shutter glasses.
160
March 2018
PHOTOGRAMMETRIC ENGINEERING & REMOTE SENSING


