Transform (
SIFT
) key-points (Lowe, 2004) with the highest
matching similarity values. For the regular gird tie-points (see
the second column of Figure 5), we collected 16 left points
from the dense disparity map generated by our in-house
GOTCHA
matcher. Participants were then asked to validate
their matching correctness based on visual clues by moving
the stereo 3D cursor around the grid points to check if there
were any abnormalities and adjusting the disparity offset of
the stereo cursor at certain points to seek for better solutions.
Results in this case that passed the validation were collected
and averaged. For discontinuity tie-points (see the last col-
umn of Figure 5), an expert user from the workshop manually
selected 10 pairs of left points around the object edge and
other problematic areas. Nine pairs of discontinuity tie-points
are defined around an object boundary in C33, while the last
two tie-points are selected from a relatively smooth and less-
textured area. (see Figure 5c). Other workshop participants
then defined the correspondences on the right image.
Evaluation of Collected Tie-Points
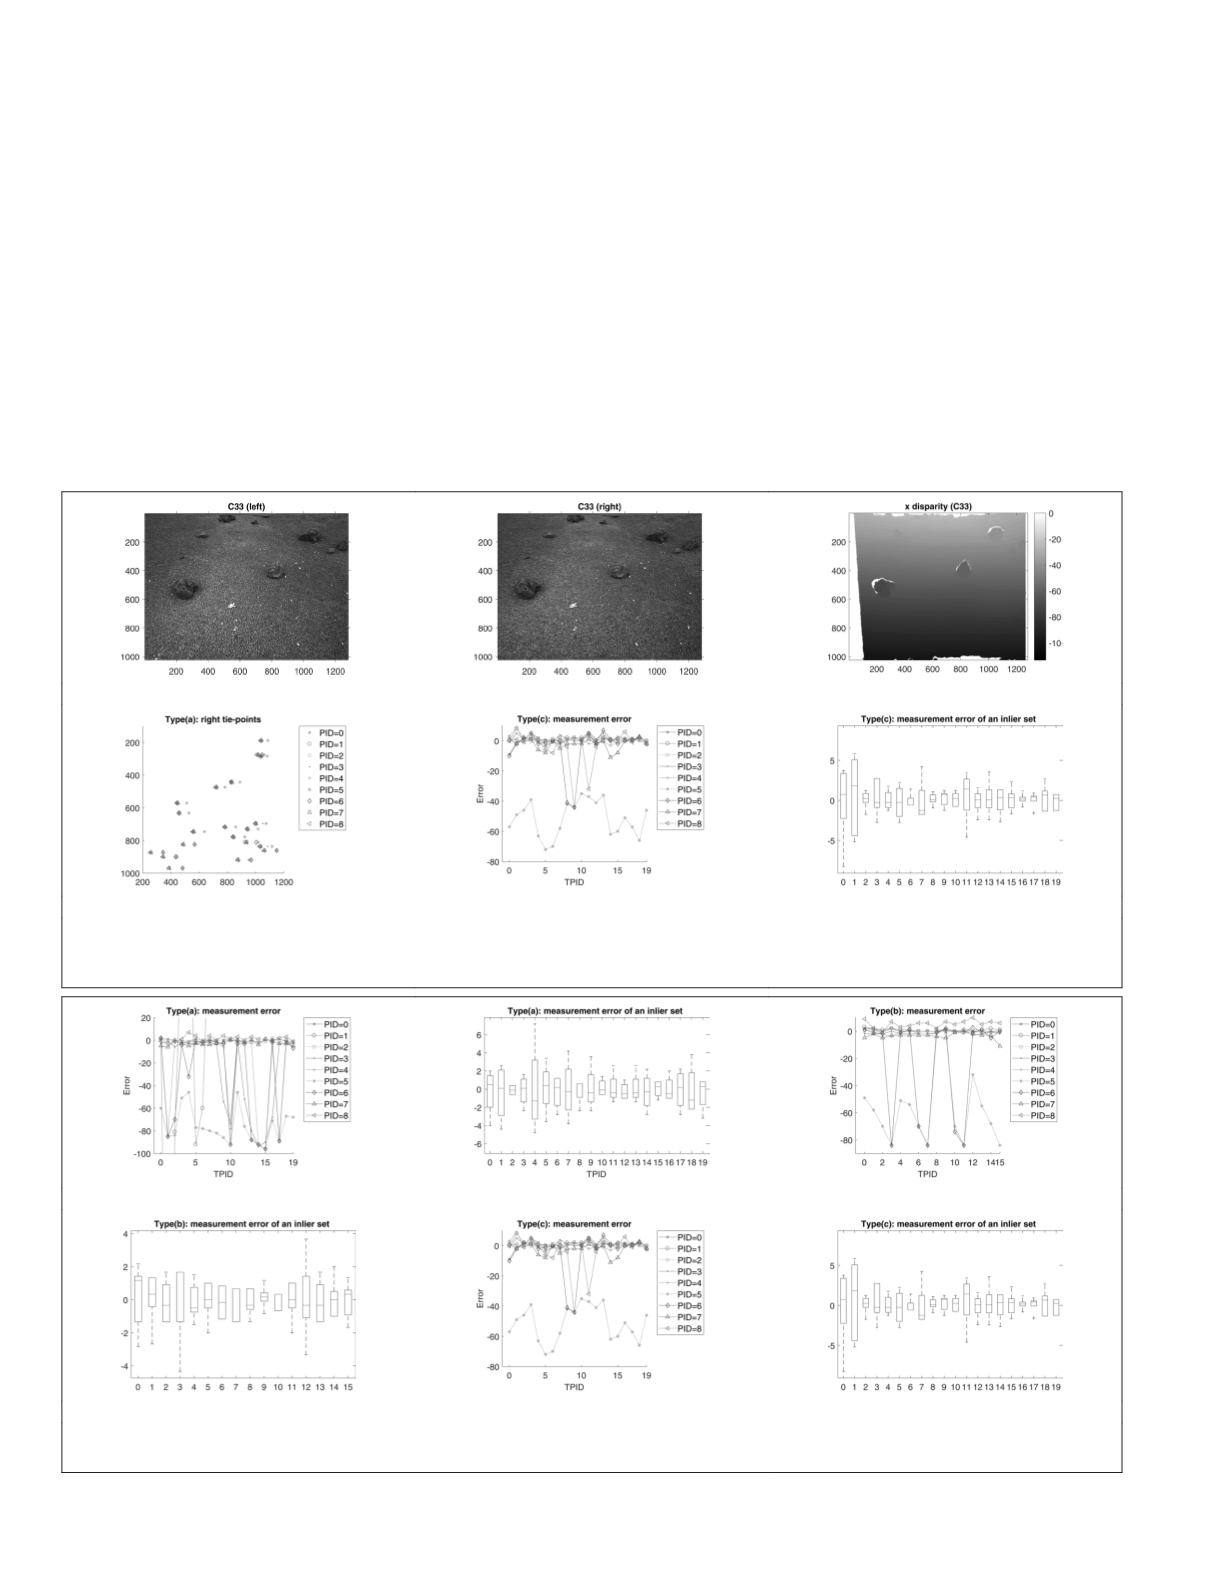
The manual selection results from the nine workshop partici-
pants are presented in Figure 6, where input data are shown
in the first row, while the positions of measured right tie-
points are presented in the second row.
It appears that some of the workshop participants can
perform good visual identification and visual validation with
all three types of tie-points. On the other hand, a few work-
shop participants were not good at fusing the stereo images.
For example, participant 1, participant 3, participant 5, and
participant 6 were not able to select good right points for
the feature based tie-points (see Figure 7a), and the perfor-
mance of participant 5, participant 6, and participant 8 was
particularly worse with discontinuity tie-points (see Figure
7e). Their average measurement error (i.e.,
e
out
) is 16.65 pixels
which is significantly above the error bounds from a normal
visual identification and validation results. Their performance
was improved when a pre-computed disparity map is given
although two participants still cannot visualize the tie-points
(a)
(b)
(c)
(d)
(e)
(f)
Figure 6. Example results of manual selection: (a) and (b) left and right input image of C33; (c) a disparity map of (a)
produced by
UCL
which was used to identify outliers in manual measurements; (d), (e), and (f) show all measured right tie-
points for type (a), (b), and (c), respectively; (note: PID stands for Participant ID).
(a)
(b)
(c)
(d)
(e)
(f)
Figure 7. Example evaluation results from the manual measurements of C33: (a), (c), and (e) are the measurement errors from all
the collected tie-points for type (a)-(c); (b), (d), and (f) bar charts of the measurement errors of inlier tie-points for type (a)-(c).
164
March 2018
PHOTOGRAMMETRIC ENGINEERING & REMOTE SENSING


