image radiometry, temporal consistency, and simulated crack
damage detection.
When examining
EV
bias and its effects on dynamic range,
we found that the minimum intensity and standard deviation
bin values for the 8-bit and 12-bit images are nearly identical.
Identical results were not expected, given that both the 8-bit
and 12-bit images underwent different, lossy compressions,
performed onboard the camera, which compressed the dy-
namic range for the 8-bit images, and created gaps in the dy-
namic range of the 12-bit images, as explained in the Results
Section. This prevented direct comparability between 8-bit
and 12-bit dynamic ranges, as the linear 1:16 ratio between
the two was disrupted. Images close to, or with a positive
bias above neutral exposure, had the highest standard devia-
tion of image intensity values, indicating that they had the
widest distribution of
DN
values. These images did not have
as high of an overall dynamic range however, as the images
with a negative exposure bias of -1 or below did. The balance
between a full dynamic range, a wide distribution of values,
and high visual contrast seems to occur at either the −0.7 or
−0.3EV exposure bias.
As indicated in the literature review, white balance is a
potential source of unintentional image variance if not con-
trolled as a variable. Within this study, the variation in white
balance was relatively small between all of the test images.
This leads to minor variations in
DN
values if not controlled
as a postprocessing variable.
Test results for light metering methods indicate that
“center weighted” outperforms “overall” light metering. This
seems intuitive given the smaller area used for illumination
calculation by center weighted method than by the overall
method, and lower potential for the periphery of the scene to
cause calculation variability. However, this leaves the sensor
operator with a choice between more consistent light meter-
ing, and light metering which best takes into account varia-
tions in illumination along the periphery of the scene.
Detector gain as measured by
ISO
was the camera control
variable that proved the most difficult to compare quantita-
tively, and no clear trend emerged when comparing images
with simulated cracks across varying
ISO
levels. Visually,
images become grainier, with increased shot noise beyond ap-
proximately the
ISO
200 level, with marginal image degrada-
tion up to about
ISO
800.
The experimental tests to measure the effects of relative
aperture value on vignetting yielded variable results, de-
pending on the intended image use. If images are captured
with an area of interest in the center 40 percent of the image,
rather than for generating an image mosaic where most of
an image frame is used in the final product, the use of wider
apertures with more pronounced vignetting effects, is accept-
able. This is because the areas of brightness fall off primarily
occur within the outer portions of an image frame. In this
case, the recommended
f
/stop should be a higher to minimize
brightness fall-off effects. Within the frame-based change
(a)
(b)
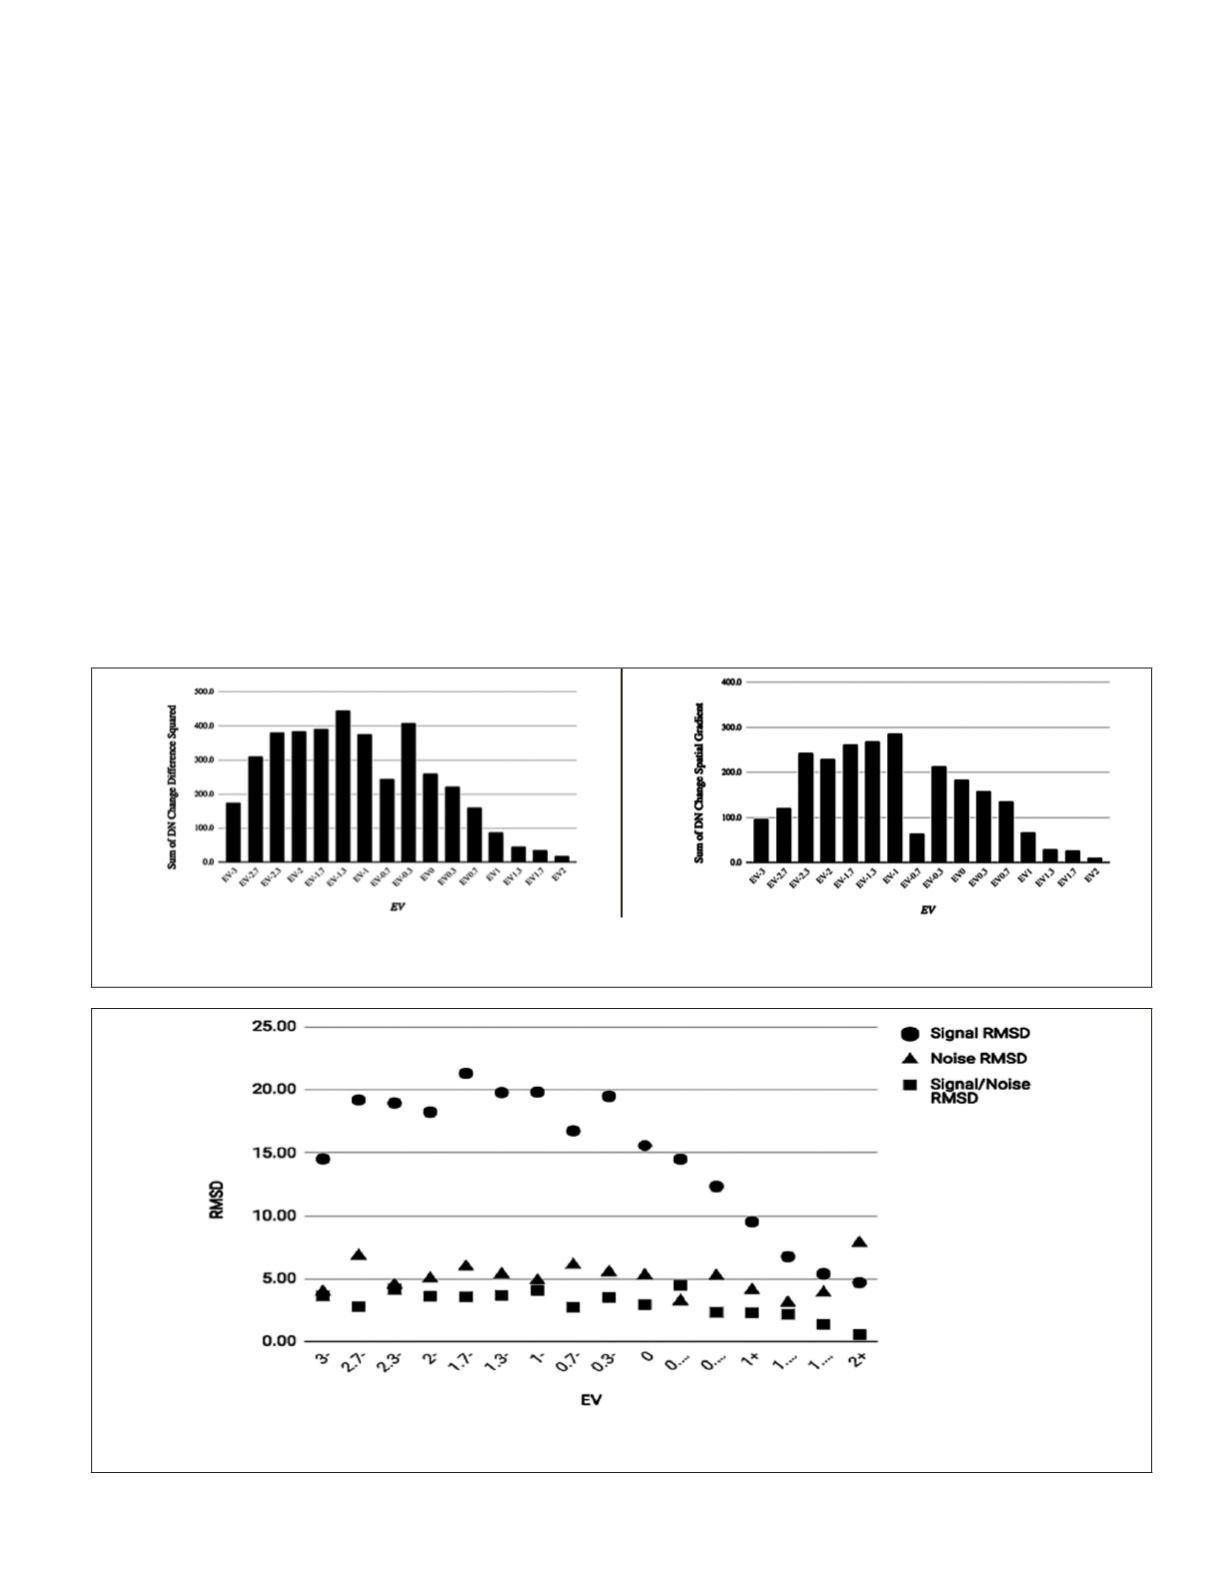
Figure 9 (a). Effects of
EV
bias setting on simulated crack detection as measured by the squared
DN
change difference
magnitude, and (b) Effects of
EV
bias setting on simulated crack detection as measured by the spatial gradient of the
difference between adjacent pixels, squared (right), of the simulated crack pixel profiles by
EV
bias.
Figure 10.
RMSD
intensity values of bi-temporal image pairs extracted for the ‘signal’ (image difference of the crack area) and
‘noise’ (image difference of concrete wall background) subsets of Figure 8c, for the simulated crack detection assessment.
PHOTOGRAMMETRIC ENGINEERING & REMOTE SENSING
March 2018
157


