other 3 series of experiments (image D by using
MSS
, image
E by using
MSS
, and
ECWS
), the overall tendency of intraseg-
ment homogeneity is decreasing. The fluctuates in the result
of intrasegment homogeneity is the same with those previous
research results (Ming
et al
., 2015).
As is known, low intrasegment homogeneity (under-
segmentation) is not capable of supporting high classification
accuracy. Meanwhile, when the scale parameter is too small,
there is no too much influence on
OA
even over-segmentation
happens. Theoretically, when over-segmentation happens,
the intersegment heterogeneity is usually very low, which is
bad for classification because low intersegment heterogeneity
means low separability between classes, just as stressed by
Castilla
et al
. (2014), small fragmented objects are prone to
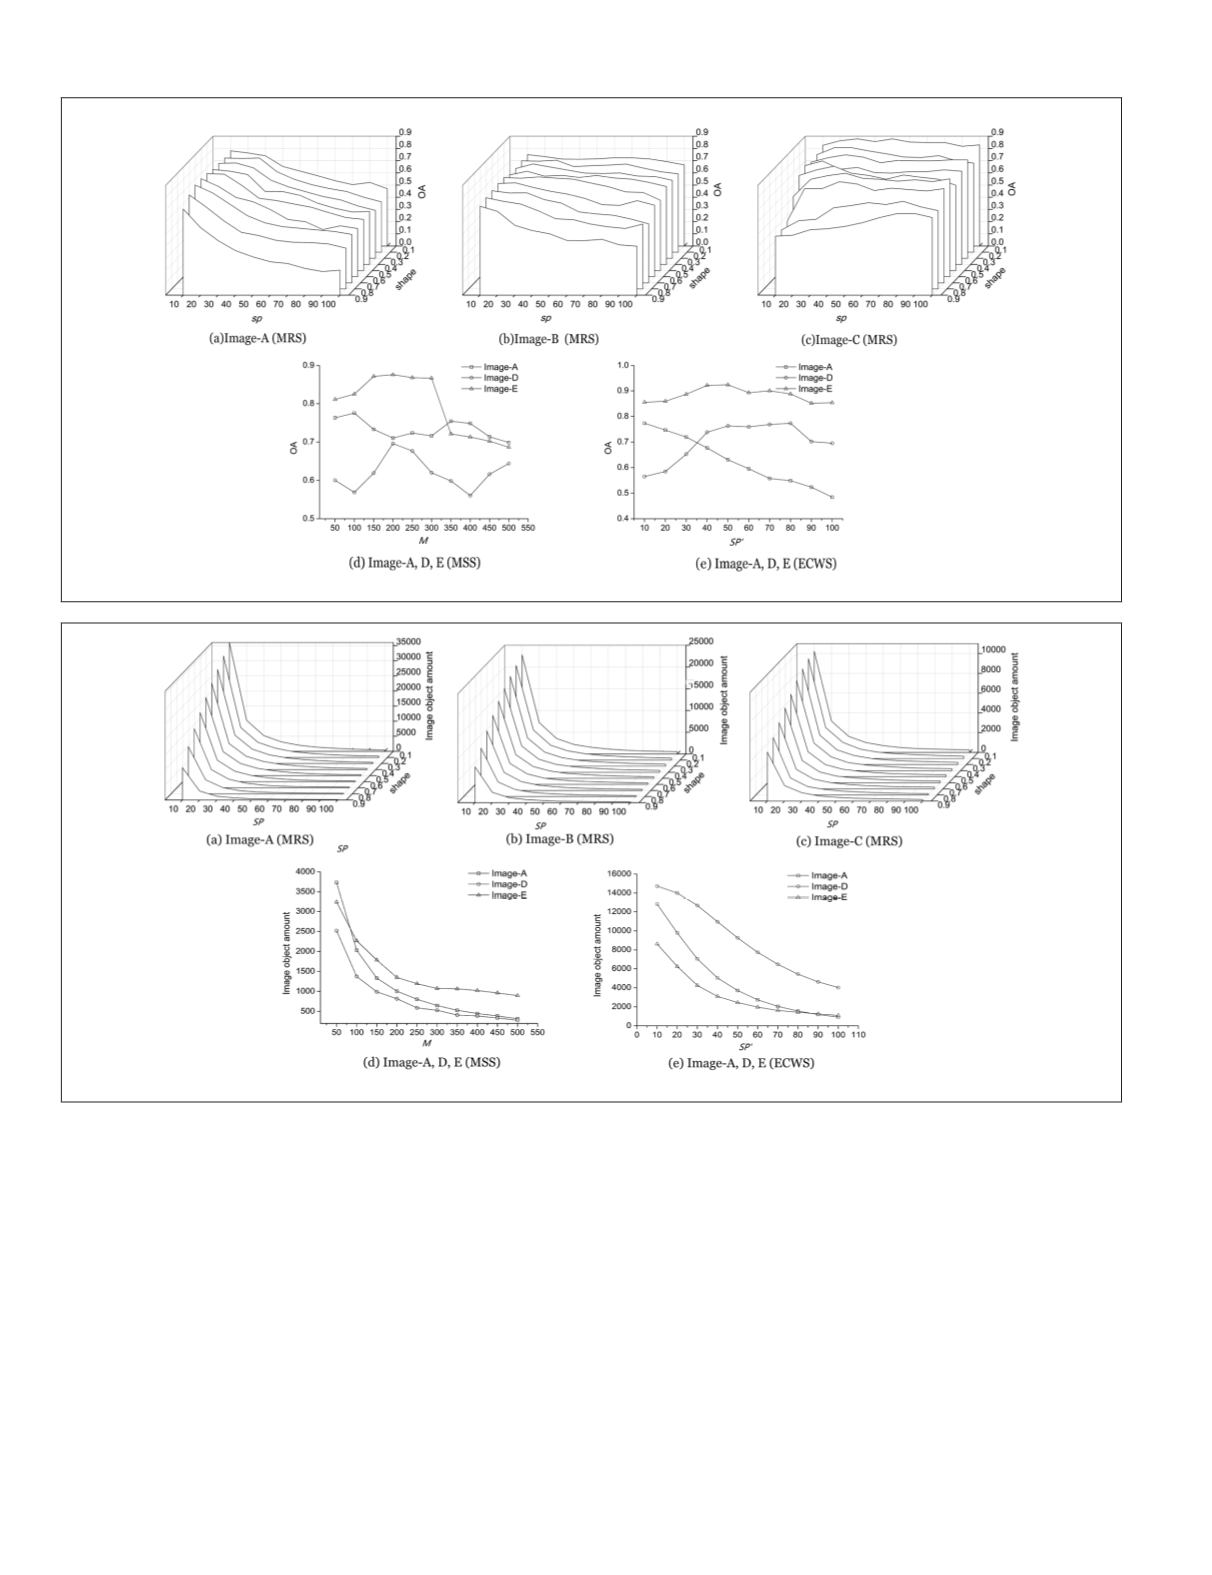
misclassification. However, as reflected by Figures 4 and 5, if
the selected samples could covers all kinds of feature distri-
bution of classes, high interclass correlation can companied
with high classification accuracy even though over-segmenta-
tion happens.
Figures 5 and 6 also show that the
OA
usually is not the
highest when the spectral heterogeneity or the merging
threshold value is set too small and large image object size are
also prone to misclassification due to the low intrasegment
heomogeneity (pixels of different classes are merged into the
same image object).
Intersegment Heterogeneity and OA with Change of Image Object Amount
From the view of intersegment heterogeneity, as demonstrated
in Figure 4, with increase of image object amount, the ten-
dency of intrasegment homogeneity changing with decrease of
image object amount varies from each other, which is because
that the landscape complexity within the five image is differ-
ent from each other however the scale parameter extents for
all image data are the same. Theoretically, the more complex
Figure 5. Overall classification accuracies (
OA
) changing with different parameters by using different segmentation methods.
Figure 6. Image object amounts changing with different segmentation methods and different parameters.
688
November 2018
PHOTOGRAMMETRIC ENGINEERING & REMOTE SENSING


