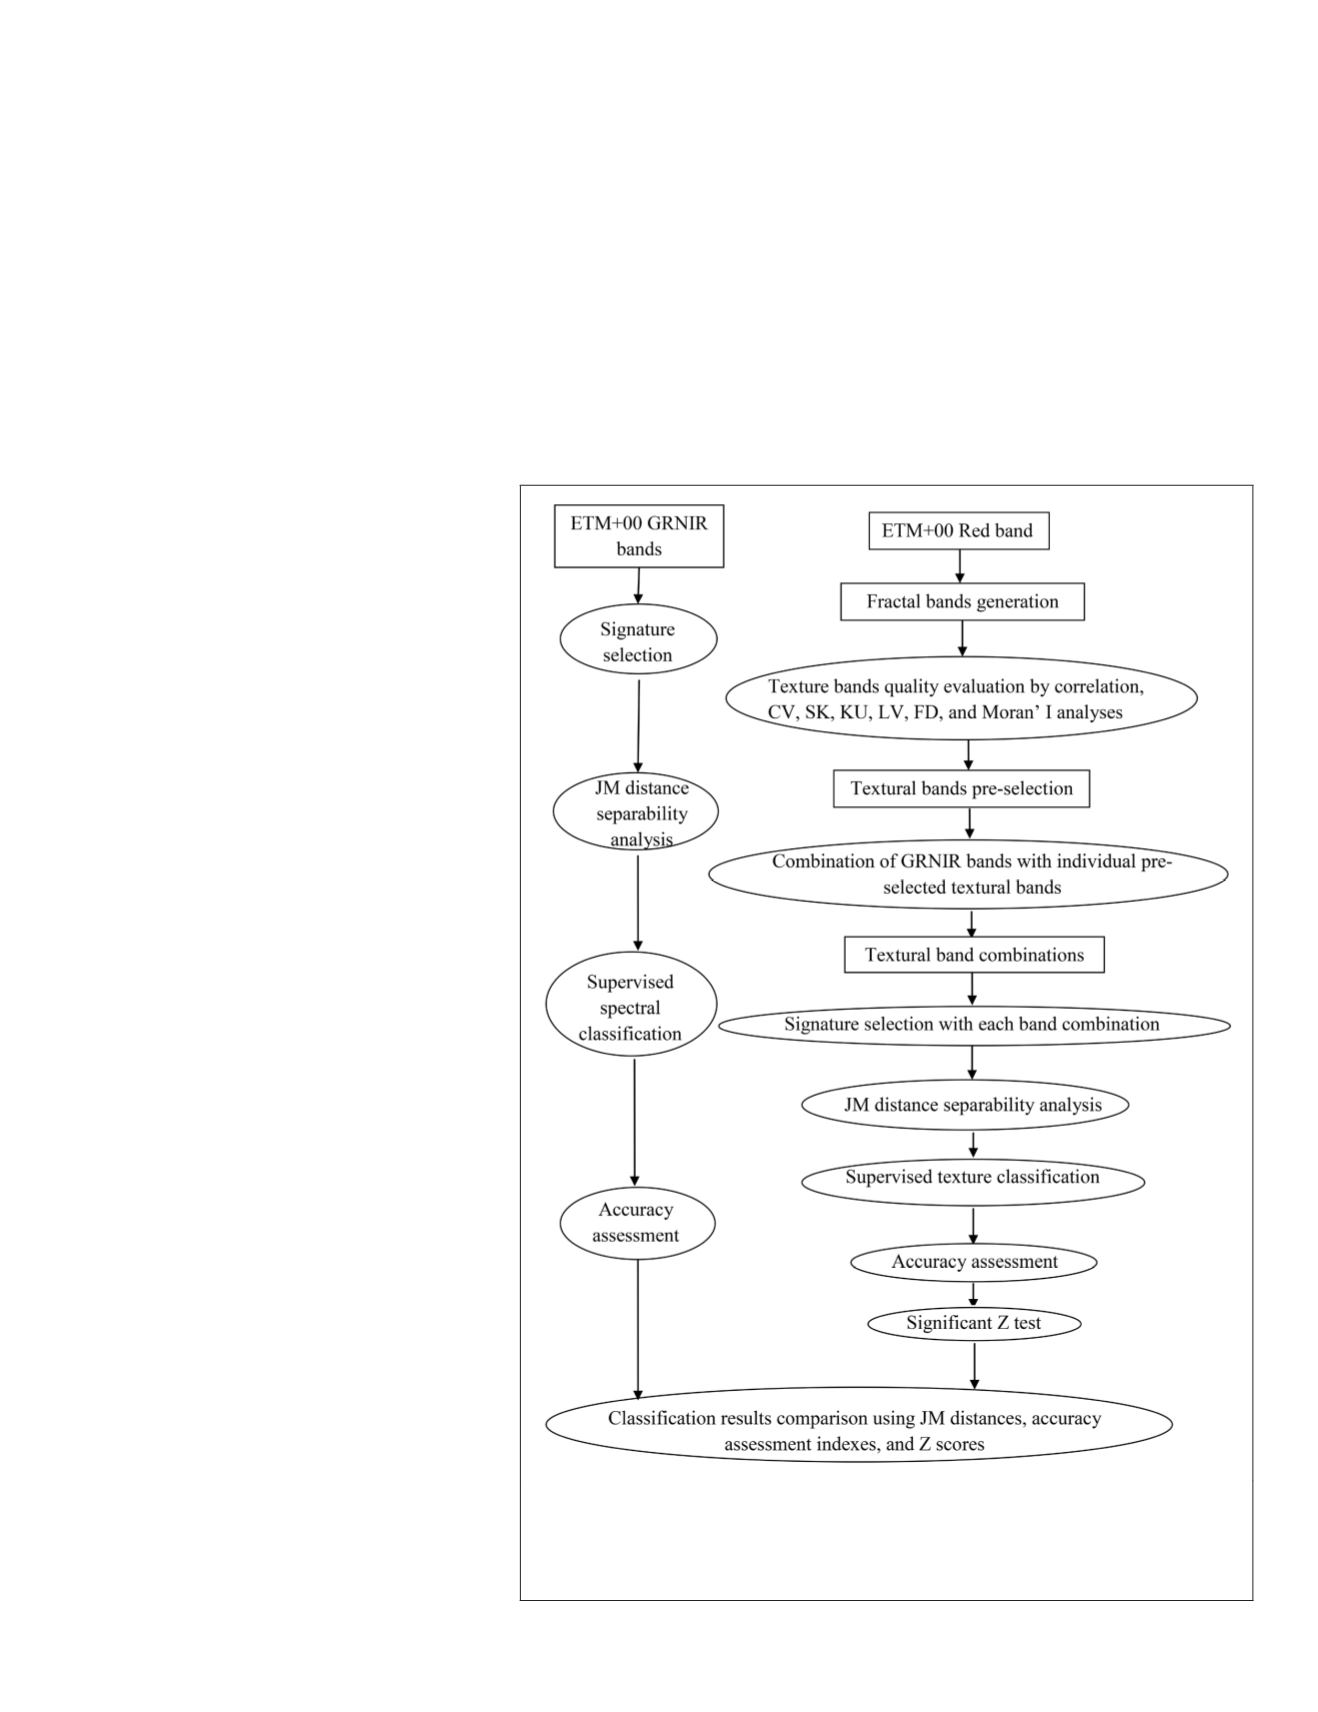
The image was first georectified to a common
UTM
coordinate
system using the 1:24 000-scale topographic maps as the
reference. The resultant value of Root Mean Square error was
found to be less than 0.4 pixel. This image was then analyzed
and interpreted further by following the procedure indicated
in Figure 2 and discussed below.
Methodology
Creation of Fractals-based Texture Bands
Many algorithms have been developed to compute
FDs
for
raster images. This study utilized a popular fractal analysis
software called Image Characterization and Modelling System
(
ICAMS
) that was developed and is maintained by Dr. Nina
Lam’s research team to generate fractal-based texture images
. Liang
et al.
(2013)
performed a detailed evaluation of the
effectiveness of several popular fractal algo-
rithms available in
ICAMS
on characterizing
urban spatial complexity of Indianapolis
recorded in various types of satellite images
including the same Landsat
ETM+
image that
was used in the current study. Results from
this study showed the red band of the
ETM+
image contains the most spatial content and
the triangular prism method was proved to
be the most robust algorithm in estimating
FD
values from multiple datasets such as the
Landsat data. As a result, the image’s red
band and the triangular prism method were
used to generate the fractals-based texture
bands in this study. The algorithm of trian-
gular prism employs the idea of interpreting
images from a three-dimensional perspec-
tive by viewing all the pixel values as
“elevations”. A prism with four triangular
facets is then constructed as the top roof of
a cube whose walls are four adjacent pixels’
elevations and central axis is a vertical line
at the height of these pixels’ mean eleva-
tion. The method is implemented by using
these triangular facets as the basic tool to
fill an image surface until the total surface
area is calculated. With the Landsat image
having a total of 1,115 × 1,105 pixels, it
typically took no more than four minutes to
create one fractal-based texture feature us-
ing
ICAMS
. In the end, a total of twenty-five
texture bands were created with window
sizes started at 13 × 13 pixels and ended at
61 × 61 pixels.
Evaluation of Fractals-based Texture Features
The study intended to fully evaluate the
change of fractal-based texture feature
in response to every single window size
employed in the feature extraction. Yet this
seemed to be challenging with an automatic
process such as machine learning that often
hides such information in the background
(Nigussie
et al.
, 2011; Shi
et al.
, 2009).
Therefore, a semi-automated procedure
was adopted to first measure the properties
of each textural feature by using statistics
listed below, and the visualization and inter-
pretation was then integrated in an objective
way so that the decision-making of choosing
appropriate features for the subsequent
ML
image classification could be well presented.
Texture Band Evaluation with Correlation Analysis and Mutual Information
The current study considered the
ML
classifier for image clas-
sification. Previous studies suggested that the selected texture
feature as the classification input should be those having low
correlations with other spectral bands (Shaban and Dikshit,
2001), since they could supply additional information not
much similar to those from spectral images of interests. For
this reason, the Pearson correlation coefficients were cal-
culated among all resulting texture features and the three
selected reflective bands (green (G), red (R), and near infrared
(NIR)) that were used for image classification. Nevertheless, a
low coefficient from this correlation analysis does not mean
the “less redundant” information offered by texture features
is necessarily useful in the per-pixel image classification,
since the latter often also requires to take the independence of
selected input bands into account. In the current research, for
Figure 2. A flowchart of
ETM+
00 image classification by integrating fractal-
based textural information derived from the triangular prims fractal algorithm
(
GRNIR
: Green/Red/Near Infrared;
CV
: coefficient of variation;
SK
: absolute
SK
ewness,
KU
: absolute difference of
KU
rtosis;
LV
: local variation;
FD
: fractal
dimension; JM distance: Jefferies-Matusita distance).
PHOTOGRAMMETRIC ENGINEERING & REMOTE SENSING
November 2018
697


