Data
SPOT6
imagery obtained on 27 July 2016 and
SPOT7
satellite
imagery obtained on 28 July 2016 were used in the study.
SPOT6
and
SPOT7
satellites have 180-degree shifted orbits to increase
temporal resolution by using twin satellites resulted in daily re-
peated passes capability over at any point in the world.
SPOT6
/7
images acquired with large swaths thus they cover large areas
(approximately 60 × 60 km) and that make them suitable for
mapping and monitoring applications. Both satellites offer 1.5
meter high resolution products with five simultaneous sensed
spectral bands (Pan / R / G / B / NIR) (Airbus, 2013).
Urban Atlas nomenclature is used in this study for identifi-
cation of
LCLU
classes. Urban Atlas nomenclature has 20
LCLU
classes and 17 of them are urban related classes. Urban fabrics
are subdivided to five classes according to their soil sealing
properties. Detailed information on urban atlas classes could
be found in European Union, Mapping Guide for a European
Urban 2011. District boundaries and municipal boundaries
have been used to determine the boundaries for the research
area. Local zone plans for urban areas of districts which
defined as highly accurate definitions of artificial surface
areas (urban fabrics, industrial, commercial, military, public
areas, etc.), and roads were used as auxillary data in the clas-
sification process. The vector data for the road and railroad
used as ancillary data for rural areas is provided by the data
generated by OpenStreetMap. The forest vector data obtained
from the Ministry of Forests was used as ancillary data in the
classification phase of rural areas. Soil sealing layer values
obtained from
NDVI
raster images that creating from
SPOT6/7
images. These values have been used to assign five subclasses
of urban fabric.
Methodology
The spatial heterogeneity of high resolution satellite images is
high due to high geometric details they contain. The geometry
of the objects in targets and the heterogeneity within them
represent different spectral reflections of these areas express-
ing the same land cover. Therefore, such high resolution
satellite images should be classified with object-based method
instead of pixel-based to produce a more homogeneous and
accurate map product (Herold
et al
., 2003).
In the object-based classification method, homogenous im-
age objects are created on the image by taking into consider-
ation the color, shape, and texture properties from the pixels
in the image, and these image objects are classified according
to the hierarchical and/or neighborhood rule sets (Alganci
et al
., 2013); Alganci
et al
. (2013) compared pixel-based and
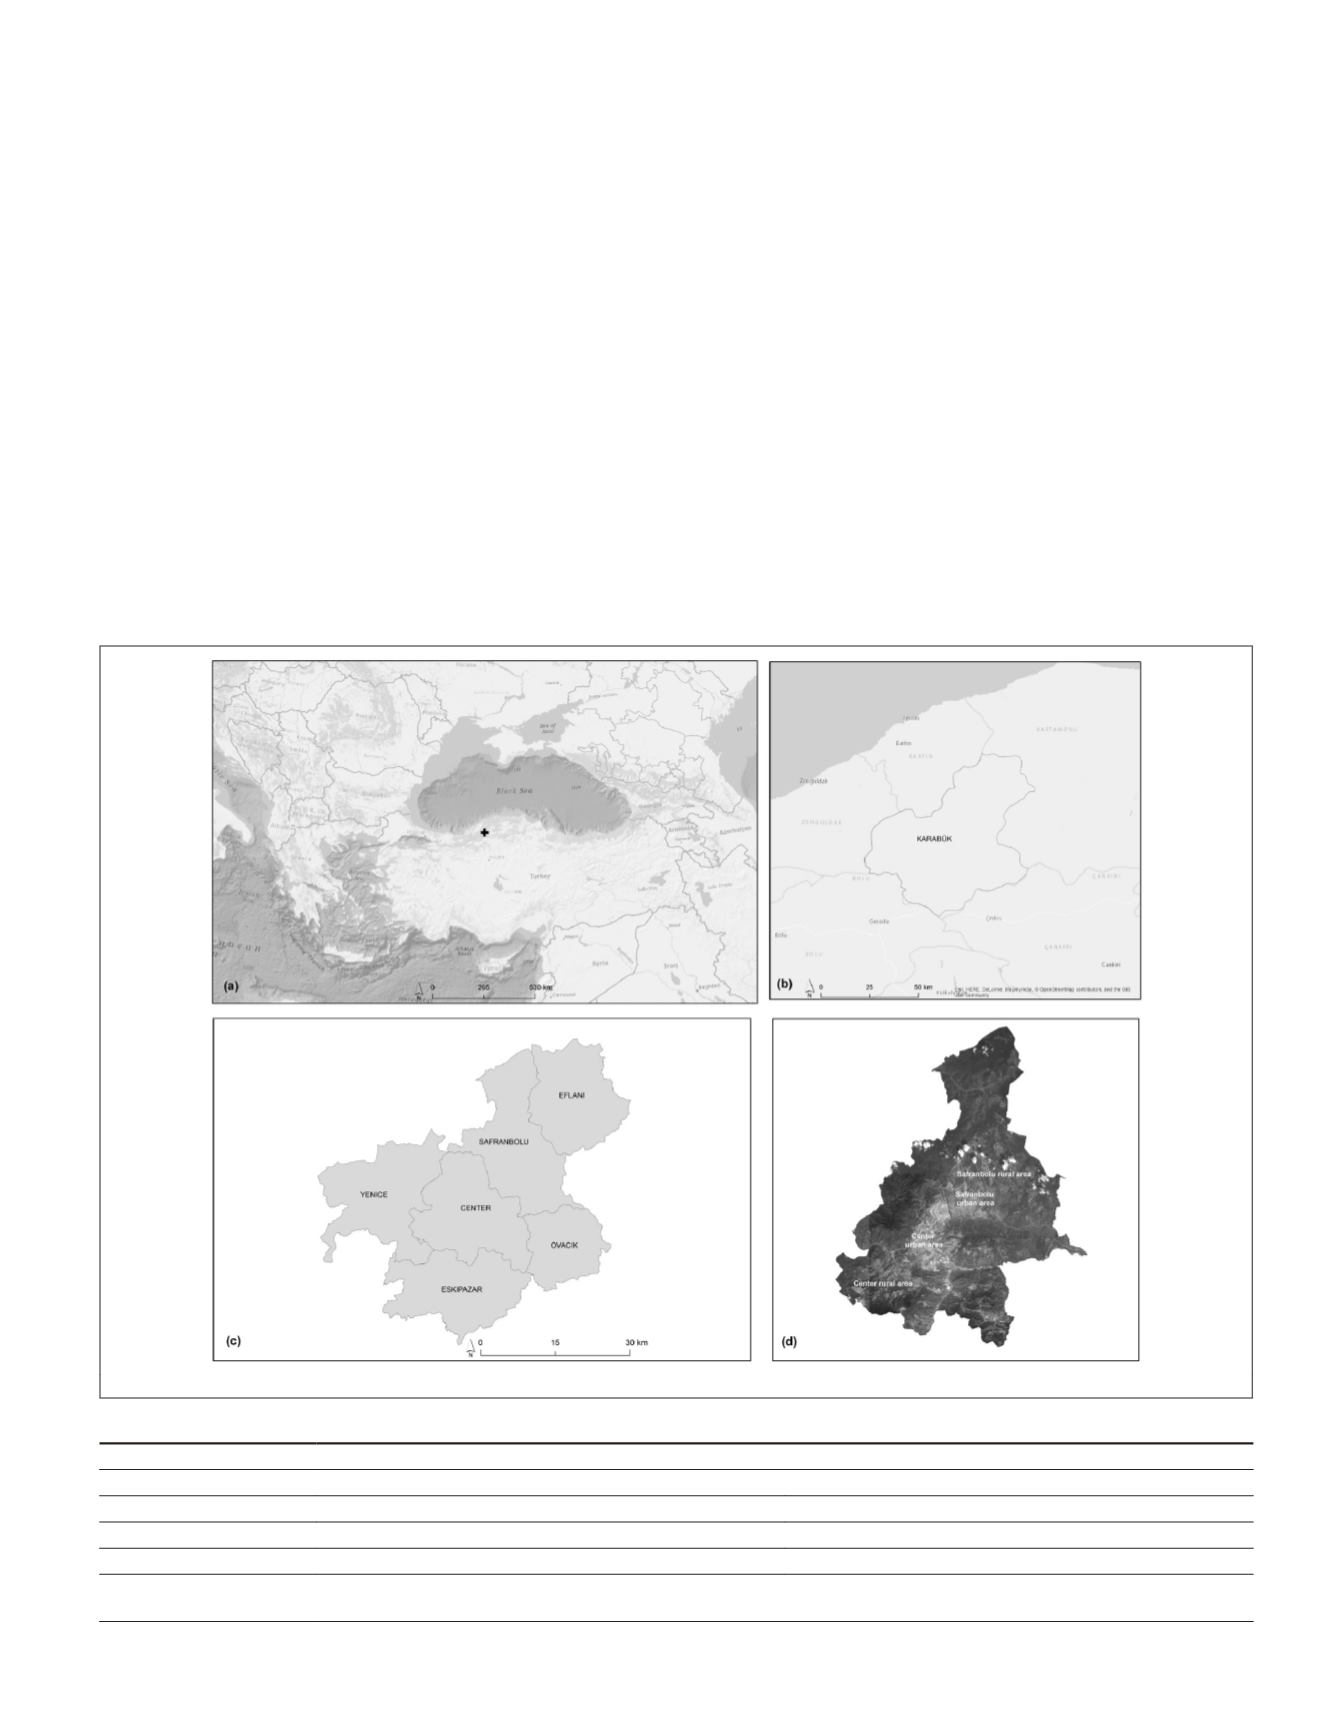
Figure 1. Study Area (a) Karabuk location, (b) Karabuk city, (c) Karabuk districts, and (d) Center and Safranbolu districts.
Table 1. Comparison of Center and Safranbolu districts with statistical values.
Center
Safranbolu
Total area
704 km
2
1023 km
2
Total population
119.303 (year 2010), 134.406 (year 2016)
59.800 (year 2010), 63.965 (year 2016)
Urban population
108.710 (year 2010), 118.373 (year 2016)
46.360 (year 2010), 46.924 (year 2016)
Rural population
10.593 (year 2010), 16.033 (year 2016)
13.440 (year 2010), 17.041 (year 2016)
Settlements in total
160 settlement (1 municipality, 38 villages
and 121 sub-villages)
241 settlement (1 municipality, 54 villages
and 186 sub-villages)
PHOTOGRAMMETRIC ENGINEERING & REMOTE SENSING
November 2018
713


