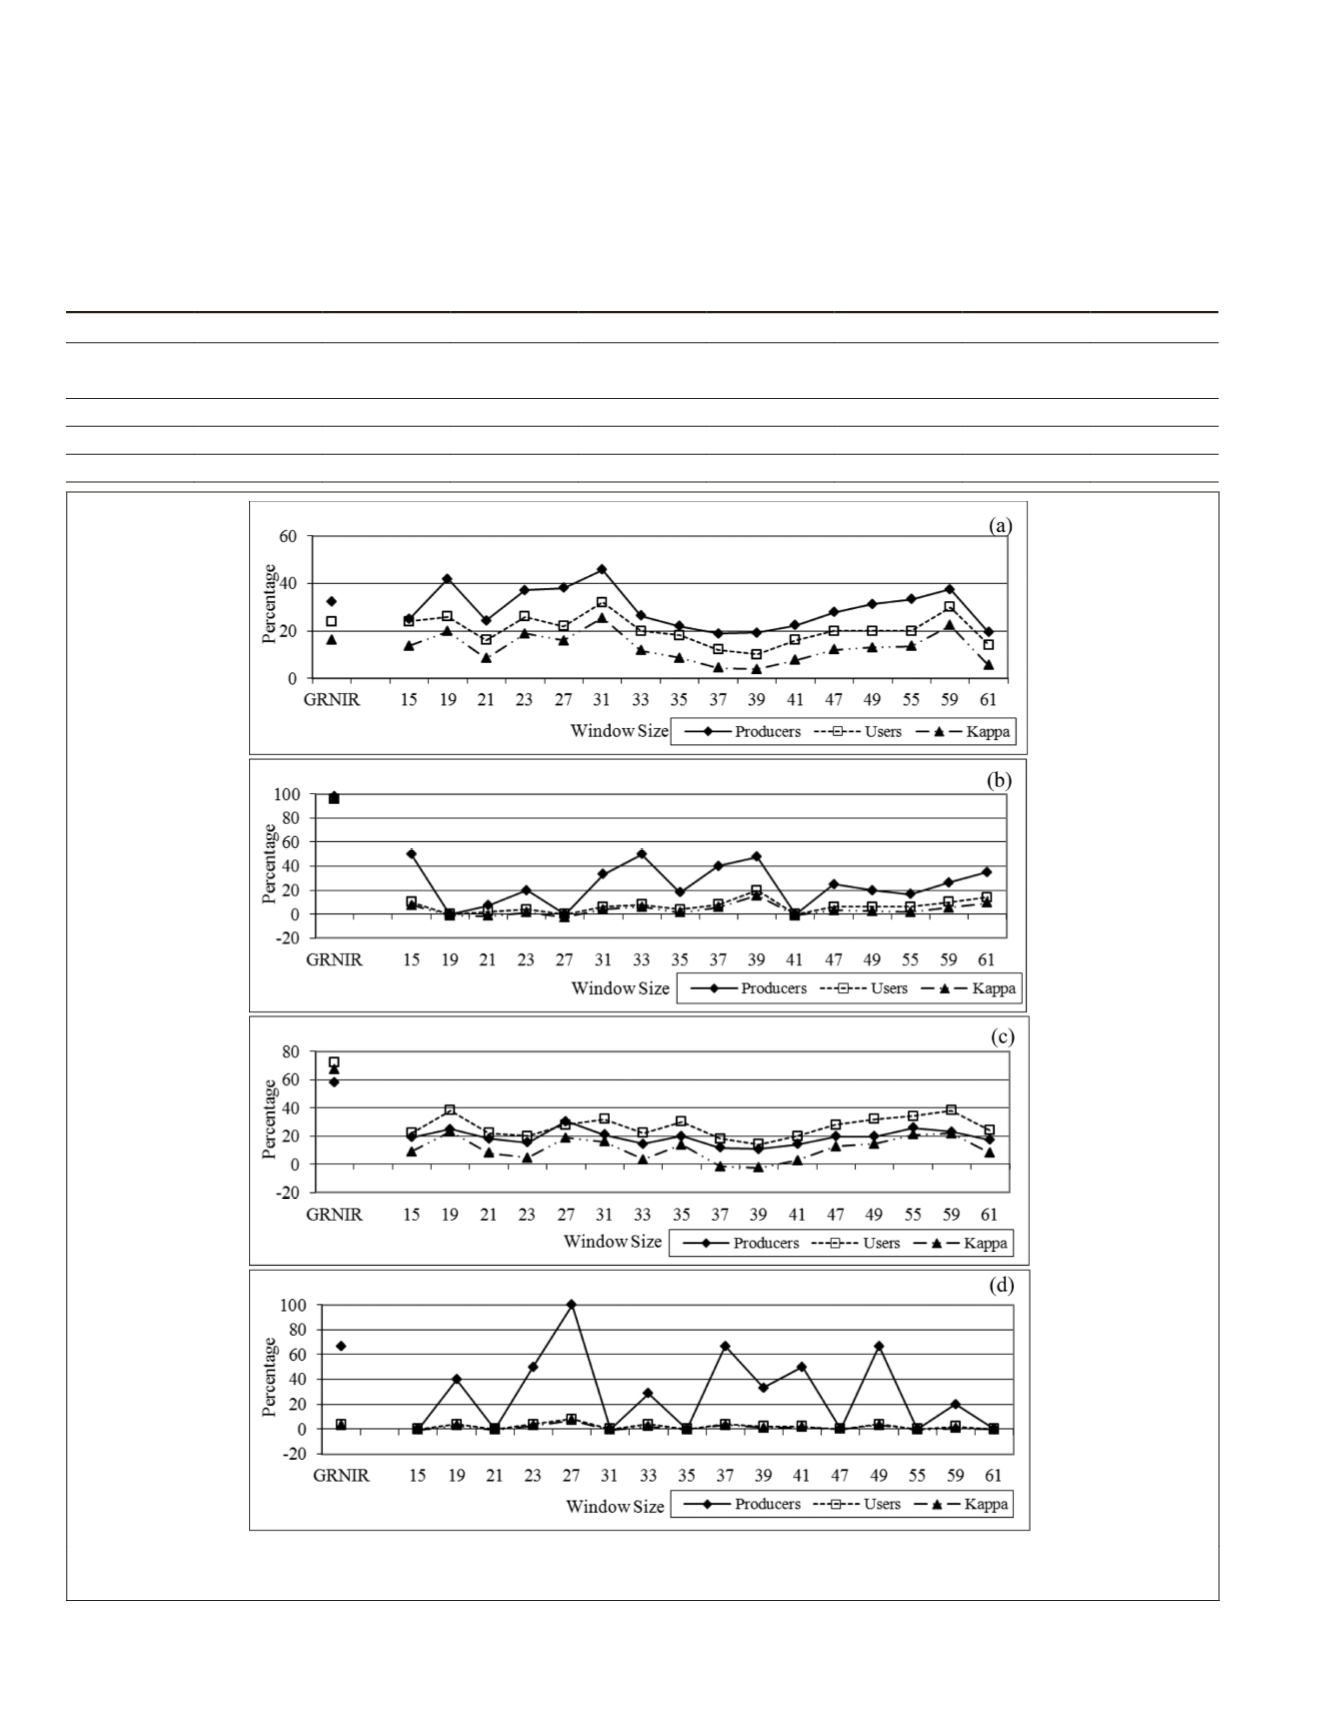
When compared to the spectral classification, none of the
textural classification is found to be better than the spectral
classification. Figure 9 also shows the values of producer’s and
user’s accuracy as well as Khat derived from the spectral clas-
sification. Generally speaking, water, forest, commercial and
industrial, and grass are successfully identified by using only
the three multispectral bands with the
ML
classifier, especially
for the first two. Yet their results from the textural classifica-
tions all turn out to be poor. This is because all the four classes
possess considerable amount of robust spectral information,
which allows them to be easily recognized by the implemen-
tation of spectral analysis only with the three raw bands.
Table 5. Summary of overall accuracy and Khat statistics (in percentage) for image classification integrated with fractal-based
texture bands derived from selected window sizes.
Size
15
19
21
23
27
31
33
35
Accuracy 21.00
23.50
19.75
21.75
23.50
25.75
18.50
19.75
Khat
9.70
12.60
8.29
1.06
1.26
15.10
6.90
8.30
Size
37
39
41
47
49
55
59
61
Accuracy 17.50
20.00
17.50
19.25
21.25
18.75
24.25
18.50
Khat
5.70
8.60
5.71
7.70
10.00
7.10
13.40
6.90
Figure 9. Producer’s and user’s accuracy and kappa coefficients by the spectral classification (
GRNIR
) and the textural
classification for cropland and pasture (a), water (b), commercial and industrial (c), and high density residential (d).
704
November 2018
PHOTOGRAMMETRIC ENGINEERING & REMOTE SENSING


