kappa values of; 0.898 and 0.886.
For rural areas of Safranbolu and
Center, 500 points were used. The
overall accuracies were respective-
ly: 92.40% and 94.60% with kappa
values of; 0.857 and 0.893.
Calculation and Analysis of Landscape
Metrics
After classification and accuracy
assessment landscape metrics were
calculated in
FRAGSTAT
software for
class and landscape levels. For ur-
ban areas, class level metric results
are shown in Table 4. In the table
SUA
is used as abbreviation for
Safranbolu urban area
CUA
is used
for Center urban area.
In this section, class level
metrics were analyzed separately
for specific urban classes that
have possible important results.
For district level analyzes, only
natural cover classes were evalu-
ated. The
CONTAG
metric results
were analyzed for both urban areas
and districts separately as they
provided information about the
entire landscape not for each class.
In the comparison of these urban
areas, metric values were evaluated
together with the generated urban-
atlas-like
LCLU
maps and total area
and percentages of each classes
obtained from these maps.
Urban Fabric
Safranbolu and Center urban areas
have 548.34 ha and 788.62 ha of
urban fabric area respectively. 15%
of
SUA
and 10% of
CUA
belong to
urban fabric related classes with
different soil sealing values. For all
subclasses of urban fabric, patch
density (
PD
) values are found to be
higher in Safranbolu. This result
shows that the settlement areas of
SUA
are also quite developed.
Continuous Urban Fabric
These areas were clustered in 2-3
region in
SUA
and 4-5 region in
CUA
as can be seen from Figure 4 and
Figure 5. Newly built residential
areas shows this urban fabric in
both urban areas. There are 53.98 ha in
SUA
and 106.14 in
CUA
.
PD
values are respectively 2.46 and 2.23 and
ED
values
are 9.43 and 10.41.
SUA
has a higher
PD
value and a lower
ED
value. This shows that these areas are composed of simpler
forms than the
CUA
. Also, lower
FRAC_AM
value in
SUA
indi-
cates that simplicity of the patches.
Discontinuous Dense Urban Fabric
In
SUA
, these areas were clustered in two different regions.
In
CUA
, this urban fabric was distributed in many different
regions of the urban area which can be seen from
LCLU
maps.
Discontinuous dense urban fabric areas were 128.60 ha in
SUA
and 128.41 in
CUA
.
PD
values are 6,37 and 3,0.
ENN_MN
values
are 32.62 and 69.60, respectively. Higher
ENN_MN
value for
CUA
indicates these areas more dispersed within the region.
Discontinuous Medium Density Urban Fabric
In
SUA
, these areas were homogenously distributed to all
region. Whereas, in
CUA
, they clustered in 4-5 areas and the
patches within these areas are close to each other. There are
98.85 in
SUA
and 175.07 ha for
CUA
.
PD
values area respec-
tively 4.99 and 4.16 and
ENN_MN
values are respectively 54.17
and 39.29.
The
ENN_MN
value for the Safranbolu urban area is higher
than the value of the Center urban area for continuous and
discontinuous medium density urban fabric. This implies
that in Safranbolu, these class patches are far apart from each
other but in Center, they are closer. For discontinuous dense
and discontinuous low and very low density,
ENN_MN
value
is higher in Center urban area which shows that these areas
scattered to different regions of Center urban area and are far
away from each other.
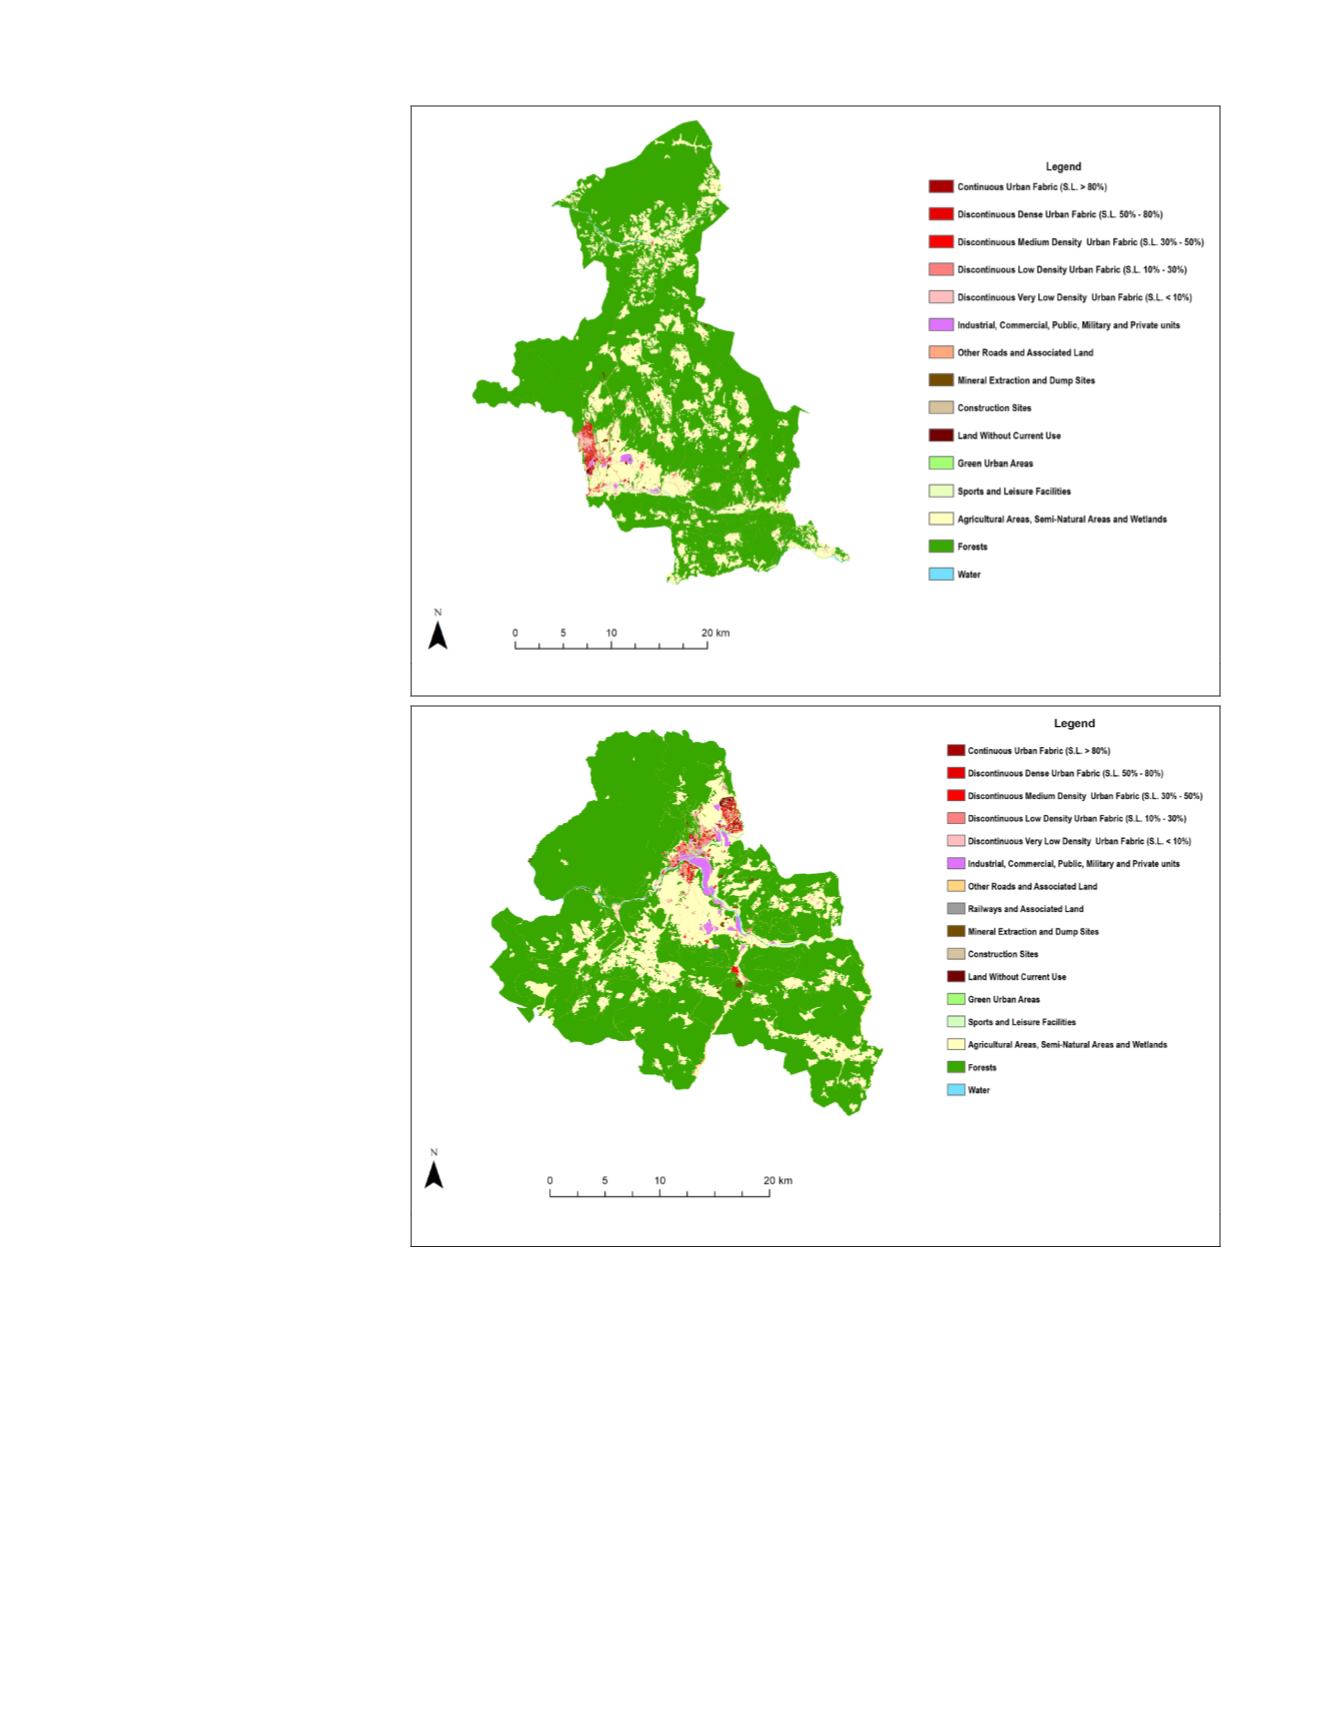
Figure 6.
LCLU
Map of Safranbolu district.
Figure 7.
LCLU
Map of Karabuk Center district.
718
November 2018
PHOTOGRAMMETRIC ENGINEERING & REMOTE SENSING


