In addition, the computation process and the algorithms
for the object matching step are complex. Also, choosing
the object matching methods and discrepancy indexes will
directly influence and affect the final evaluation result.
Therefore, determining how to choose or design an optimal
and universal object matching method and discrepancy index
for different applications and high spatial resolution remote
sensing images, is a key issue for future research about the
supervised evaluation method.
Unsupervised Evaluation Method
The unsupervised evaluation method is also known as the
empirical goodness evaluation method or the stand-alone
evaluation method. This method, requiring no reference
image, evaluates image segmentation results according to
the goodness index, which is based on human perception of
the ideal segmentation result. The widely-recognized defini-
tion of an ideal segmentation result, given by Haralick and
Shapiro (1985) is as follows: Regions should be uniform and
homogeneous with respect to some characteristic(s), adjacent
regions should have significant differences with respect to
the characteristic for which they are uniform, region interiors
should be simple and without holes, and boundaries should
be simple, not ragged, and be spatially accurate. Based on this
idea, Ming
et al.
(2009) proposed a multi-index unsupervised
segmentation method, in which six measures (removed region
number, non-uniformity within region measure, contrast
across region measure, variance contrast across region mea-
sure and edge gradient measure) were employed to evaluate
the segmentation quality.
However, as for natural images having clear texture and
structure, especially with high spatial resolution remote sens-
ing images, only the previous two rules proposed by (Haralick
and Shapiro, 1985) as mentioned above can be normally
satisfied. Since good segmentation results with high spatial
resolution remote sensing images should have both larger
intra-region homogeneity and inter-region heterogeneity.
Therefore, most unsupervised evaluation methods firstly cal-
culate the intra-region homogeneity and inter-region hetero-
geneity of each segmented object, and then obtain an overall
index for whole images by combining the local results of all
the segmented objects. The multi-index measures proposed
by Ming
et al
., (2016) are mainly corresponding to intra-
region homogeneity and inter-region heterogeneity. Lastly, the
two indexes, homogeneity and heterogeneity, are jointly used
to obtain a final goodness index, which is the key to evaluate
the segmentation result of high spatial resolution remote sens-
ing images. The following text will systematically summarize
the commonly used goodness indexes of intra-region homo-
geneity and inter-region heterogeneity, then summarize the
compositing methods of the goodness indexes.
Homogeneity Goodness Indexes
Homogeneity goodness is an index which has its base on the
first rule of ideal segmentation results. It can directly and
efficiently evaluate the segmentation results by calculating
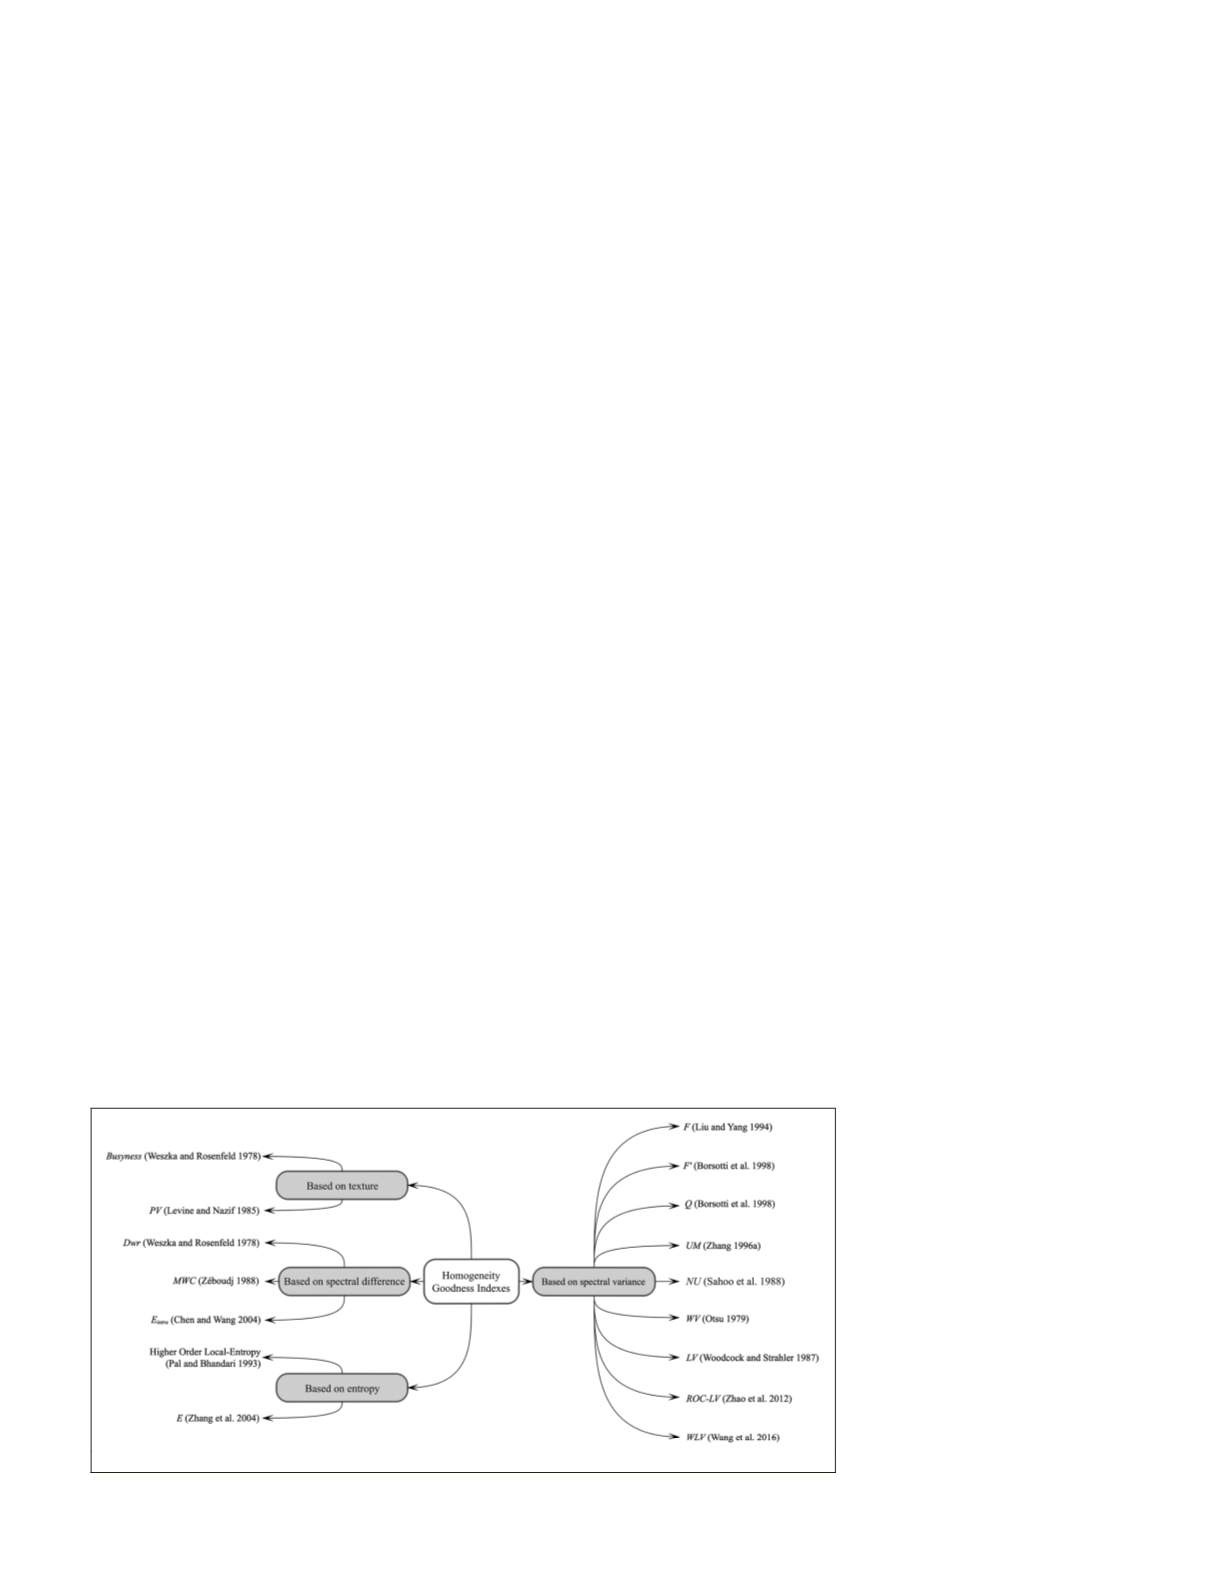
the homogeneity within a region. As shown in Figure 5, there
are currently four indices to evaluate homogeneity: good-
ness based on spectral difference, goodness based on spectral
variance, goodness based on texture, and goodness based on
entropy. In the field of remote sensing, Chabrier
et al
. (2006)
compared the performance of some proposed goodness in-
dexes for the evaluation of segmentation results with remote
sensing imagery. Among the goodness indexes mentioned
above, the goodness based on spectral difference, the good-
ness based on texture, and the goodness based on entropy are
less applied in remote sensing.
Goodness Based on Difference
Weszka and Rosenfeld (1978) proposed goodness according
to spectral difference,
D
wr
, between the original pixels of the
segmented object and the pixels after threshold segmentation,
which is applied to evaluate the foreground and background
image segmentation algorithm, based on the value of thresh-
old. Zéboudj (1988) derived the Max Within-Region Contrast
(
MWC
) goodness according to the maximum spectral difference
between the intra-region pixels of the segmented object and
the adjacent pixels. Chen and Wang (2004) proposed the Intra-
Region Visual Error (E
intra
) goodness on the basis of the differ-
ence between the spectral value of each pixel in the segment-
ed object and the average spectral values within the object.
Goodness Based on Spectral Variance
In comparison to the goodness based on spectral difference,
which mostly consider only the intra-region homogeneity in
a local pixel level instead of segmented object level, goodness
based on spectral variance, measuring the intra-region homo-
geneity in segmented object level, responds more optimally to
the intra-region homogeneity. Liu and Yang (1994) proposed
F
goodness based on average spectral variance of segmented
objects, where over-segmentation phenomenon are penalized
by weighting the square root of the number of segmented ob-
jects. However,
F
still has biases: with the increasing number
of segmented objects, the value of
F
will rapidly decrease to
zero regardless of the high spectral variance value. Borsotti et
al. (1998) described
F
′
and
Q
goodness to correct the biases
in
F
. Although
Q
is better at segmentation evaluation, the de-
velopment of its formula is based on empirical analysis, and
may still cause biased evaluation
in some special situations. Zhang
(1996a) took the segmented objects’
spectral variance as a metric, and
put forward the Non-Uniformity
within Region Measure (
UM
) good-
ness. The smaller the
UM
value, the
stronger the homogeneity within
the segmented object. Furthermore,
the Normalized Uniformity Mea-
sure (
NU
) introduced by Sahoo et
al. (1988) is the normalized version
of
UM
. The larger the
NU
value, the
stronger the homogeneity within
the segmented object. Otsu (1979)
defined the Within-Class Variance
(
WV
) goodness, in accordance with
the weighted sum spectral vari-
ance of the segmented object and
its adjacent object.
WV
considers
Figure 5. Hierarchical map of commonly used homogeneity goodness indexes.
PHOTOGRAMMETRIC ENGINEERING & REMOTE SENSING
October 2018
637


